How to Use the Ping Command to Find Network Failures Before Users Report Them
How long does it take you to work out whether "the network is down" means a dead laptop, a failed switch, a WAN problem, broken DNS or an application fault? Most IT staff reach for the same first move. They open a terminal and type ping.
That first move is fast, but the output is easy to misread, and a wrong reading sends troubleshooting in the wrong direction while the outage continues. A timeout can come from a firewall rule on a healthy server, while a successful reply can come from a server whose application has stopped working. Add three operating systems with slightly different flags, and mistakes become easy to make.
If all you need is a definition, our glossary has a short entry on what ping is. In this blog, you will see how the command behaves on Windows, Linux and macOS, which ping parameters are worth remembering, how to interpret ping results and the errors you'll meet, and a six-step routine we'd hand any new administrator for isolating connectivity failures. We close on the question every growing network eventually faces, namely when manual checks stop being enough and what continuous observability should cover in their place.
What is the Ping Command?
The ping command, built into Windows, Linux and macOS, tests whether another device responds by sending it tiny ICMP Echo Request packets and waiting for Echo Replies. Each reply comes back with a round-trip time attached. That number, in milliseconds, is your latency to the host.
Run a ping test and the output gives you five pieces of information:
Reachability: Whether the target answered at all
Round-trip time: How many milliseconds each request took to reach the host and come back
Packet loss: What share of requests never received a reply
TTL value: A rough clue to how many routers the reply crossed
Name resolution: Whether your system could translate a hostname into an IP address
What does the ping command do beyond these five checks? Nothing more. A reply only tells you the host answered ICMP; application health, open ports and DNS records each need a test of their own.
How does the Ping Command Work?
Under the hood, the ping command trades two ICMP message types. Your machine sends an Echo Request, the target answers with an Echo Reply, and every exchange passes through five steps:
Resolve: If you typed a hostname, DNS translates it into an IP address
Send: Your system builds an Echo Request carrying an identifier, a sequence number and a timestamp
Deliver: The request goes straight to the target on your local subnet, or to the default gateway for anything further away
Reply: The target returns an Echo Reply that copies the request's data
Measure: Your system matches the sequence number, calculates the round-trip time, and reports a timeout if nothing returns in time
Sequence numbers are the useful detail here. Because each one is unique, ping can point to the exact request that vanished, or the one that arrived well behind the others.
What is the Purpose of the Ping Command in IT Operations?
The purpose of the ping command comes down to a single yes-or-no question that it answers within seconds: Can this machine reach that one right now? Nothing needs installing and nothing needs configuring, which is why it's usually the first command typed in a connectivity incident.
In practice, here is what the ping command is used for in IT operations:
Fault isolation: Confirming whether a reported outage is local, on the LAN or beyond the gateway
Latency checks: Measuring response time to a server, branch site or cloud region
Change validation: Confirming a device came back online after a reboot, patch or configuration change
Path MTU testing: Finding the largest packet that crosses a link without fragmentation
Is Ping ICMP or TCP?
Ping runs on ICMP, the Internet Control Message Protocol. It belongs to the core network protocols working at the IP layer, and since ICMP has no concept of ports, TCP and UDP never come into it.
That separation matters in practice. A firewall or cloud security group can drop ICMP and still pass web, database and API traffic without trouble. Put simply, a missing ping reply is no proof that the host is down.
How do You Use the Ping Command on Windows, Linux and macOS?
Here is how to use the ping command on any of the three systems. You open a terminal, type ping with a hostname or IP address after it, and press Enter. Comparing the ping command on Windows vs Linux vs macOS, the main differences are the defaults and the flag letters, and Windows, for instance, stops after four requests while Linux and macOS run until you press Ctrl+C.
How to Ping in Command Prompt on Windows
To ping in Command Prompt, the quickest route is the Windows key, then cmd, then Enter. People often ask how to ping in cmd versus PowerShell. The syntax is identical in both.
On Windows, these are the forms you'll use most to ping an IP address from the command line:
Command | What it tells you |
ping example.com | Sends four requests and reports replies and timing |
ping 10.0.0.10 | Tests reachability of an IP address without using DNS |
ping -a 10.0.0.10 | Also looks up the hostname behind that IP address |
ping -n 10 example.com | Sends ten requests for a larger sample |
Windows has one small convenience. You can type flags with a hyphen or with a forward slash, and as far as Windows is concerned, ping /n 10 and ping -n 10 are the same command.
Linux Ping Command
Left alone, the Linux ping command will run indefinitely. That suits live observation. For a quick check, add a count with -c.
Command | What it tells you |
ping example.com | Pings continuously until you press Ctrl+C |
ping -c 4 example.com | Sends four requests, then prints a summary |
ping -c 4 10.0.0.10 | Tests an IP address directly, bypassing DNS |
ping -D example.com | Adds a timestamp to every reply line |
Need a progress check mid-run? Press Ctrl+\ and Linux prints the statistics so far while the test keeps going.
Ping Command on macOS
Apple's build of the ping command on macOS comes from BSD, and in most cases a Linux flag works on it unchanged. The parameter tables further down point out the exceptions. Terminal is in the Applications folder, inside Utilities.
Basic test: ping -c 4 example.com
IPv6 test: ping6 example.com
These basic forms cover quick checks. Anything longer or more specific calls for flags.
Which Ping Parameters Should You Know?
Each system offers plenty of ping parameters, but four do most of the everyday work: Request count, packet size, wait time and IP version. The letters change from one platform to another, so each table below has a row for each operating system.
Continuous Ping Command
A continuous ping command runs until you press Ctrl+C. Engineers often leave one going during a reboot or cable swap, so they can see the moment replies stop and the moment they resume. For any maintenance window, it's a crude but useful network availability check.
Platform | Command | What it tells you |
Windows | ping -t example.com | Pings nonstop until you press Ctrl+C |
Windows | ping -t example.com > ping-log.txt | Saves the continuous output to a text file |
Linux | ping -D example.com > ping-log.txt | Logs every reply with a timestamp |
macOS | ping -i 5 example.com | Pings nonstop, one request every five seconds |
Windows users can press Ctrl+Break for interim statistics, and the test keeps running.
How to Run a 100 Ping Test
A 100 ping test is worth running whenever packet loss comes and goes. A link losing one request in fifty will usually look perfect over four packets.
Platform | Command | What it tells you |
Windows | ping -n 100 example.com | Sends exactly 100 requests, then summarizes loss |
Linux | ping -c 100 example.com | Sends exactly 100 requests, then summarizes loss |
macOS | ping -c 100 example.com | Sends exactly 100 requests, then summarizes loss |
Budget about a minute and forty seconds for it at the default one-second spacing.
Ping Packet Size and the Don't Fragment Flag
Packet size flags answer a narrower question: Do big packets get through intact? Add the Don't Fragment flag and the test tells you the largest packet a path accepts, known as the MTU. That figure shrinks on VPN tunnels and on WAN links that wrap traffic in extra headers.
Platform | Command | What it tells you |
Windows | ping -f -l 1472 example.com | Fails if a 1,500-byte packet must be fragmented |
Linux | ping -M do -s 1472 example.com | Same test with the Linux flag names |
macOS | ping -D -s 1472 example.com | Same test with the macOS flag names |
Why 1,472 bytes? An 8-byte ICMP header and a 20-byte IP header bring the packet to 1,500 bytes, the standard Ethernet MTU. When the test fails, reduce the size step by step until replies return, then add 28 to the last working size to get the path's MTU.
Ping Timeout, TTL and IPv4 or IPv6 Options
Timeout, hop limit and IP version are the remaining ping parameters worth knowing. Be careful here. One letter can mean three different things depending on the system.
Task | Platform | Command | What it tells you |
Reply timeout | Windows | ping -w 2000 example.com | Waits two seconds per reply, in milliseconds |
Reply timeout | Linux | ping -W 2 example.com | Waits two seconds per reply, in seconds |
Reply timeout | macOS | ping -W 2000 example.com | Waits two seconds per reply, in milliseconds |
Set TTL | Windows | ping -i 10 example.com | Limits the request to ten router hops |
Set TTL | Linux | ping -t 10 example.com | Limits the request to ten router hops |
Set TTL | macOS | ping -m 10 example.com | Limits the request to ten router hops |
Force IPv4 | Windows or Linux | ping -4 example.com | Uses IPv4 even when IPv6 is available |
Force IPv6 | Windows or Linux | ping -6 example.com | Uses IPv6 to test the newer stack |
The -t flag is the classic trap. Type it on Windows and you get a continuous ping. Linux reads that letter as a TTL setting, and macOS treats it as a limit on total run time in seconds.
How do You Interpret Ping Results?
To interpret ping results, start with the reply lines, which carry the time and TTL for each request. Then move to the summary at the end for packet loss and the range of response times. Here is one reply line from a Windows machine: Reply from 10.0.0.10: bytes=32 time=14ms TTL=117.
The table explains each field in that line and in the summary:
Field | Example | What it means |
Reply from | 10.0.0.10 | The address that answered your request |
bytes | 32 | Size of the test payload, 32 bytes on Windows and 56 on Linux and macOS |
time | 14ms | Round-trip time for this single request |
TTL | 117 | Hop counter remaining when the reply arrived |
Packets lost | 0 (0% loss) | Requests that never received a reply |
Minimum, maximum, average | 12ms, 31ms, 15ms | Spread of round-trip times across the run |
Watch the maximum. Suppose the average is 15 ms but one reply took 90 ms. That kind of spike usually means a congested link or an overloaded device along the way, and our guide to network latency shows how to pinpoint it.
What does the TTL Value Tell You?
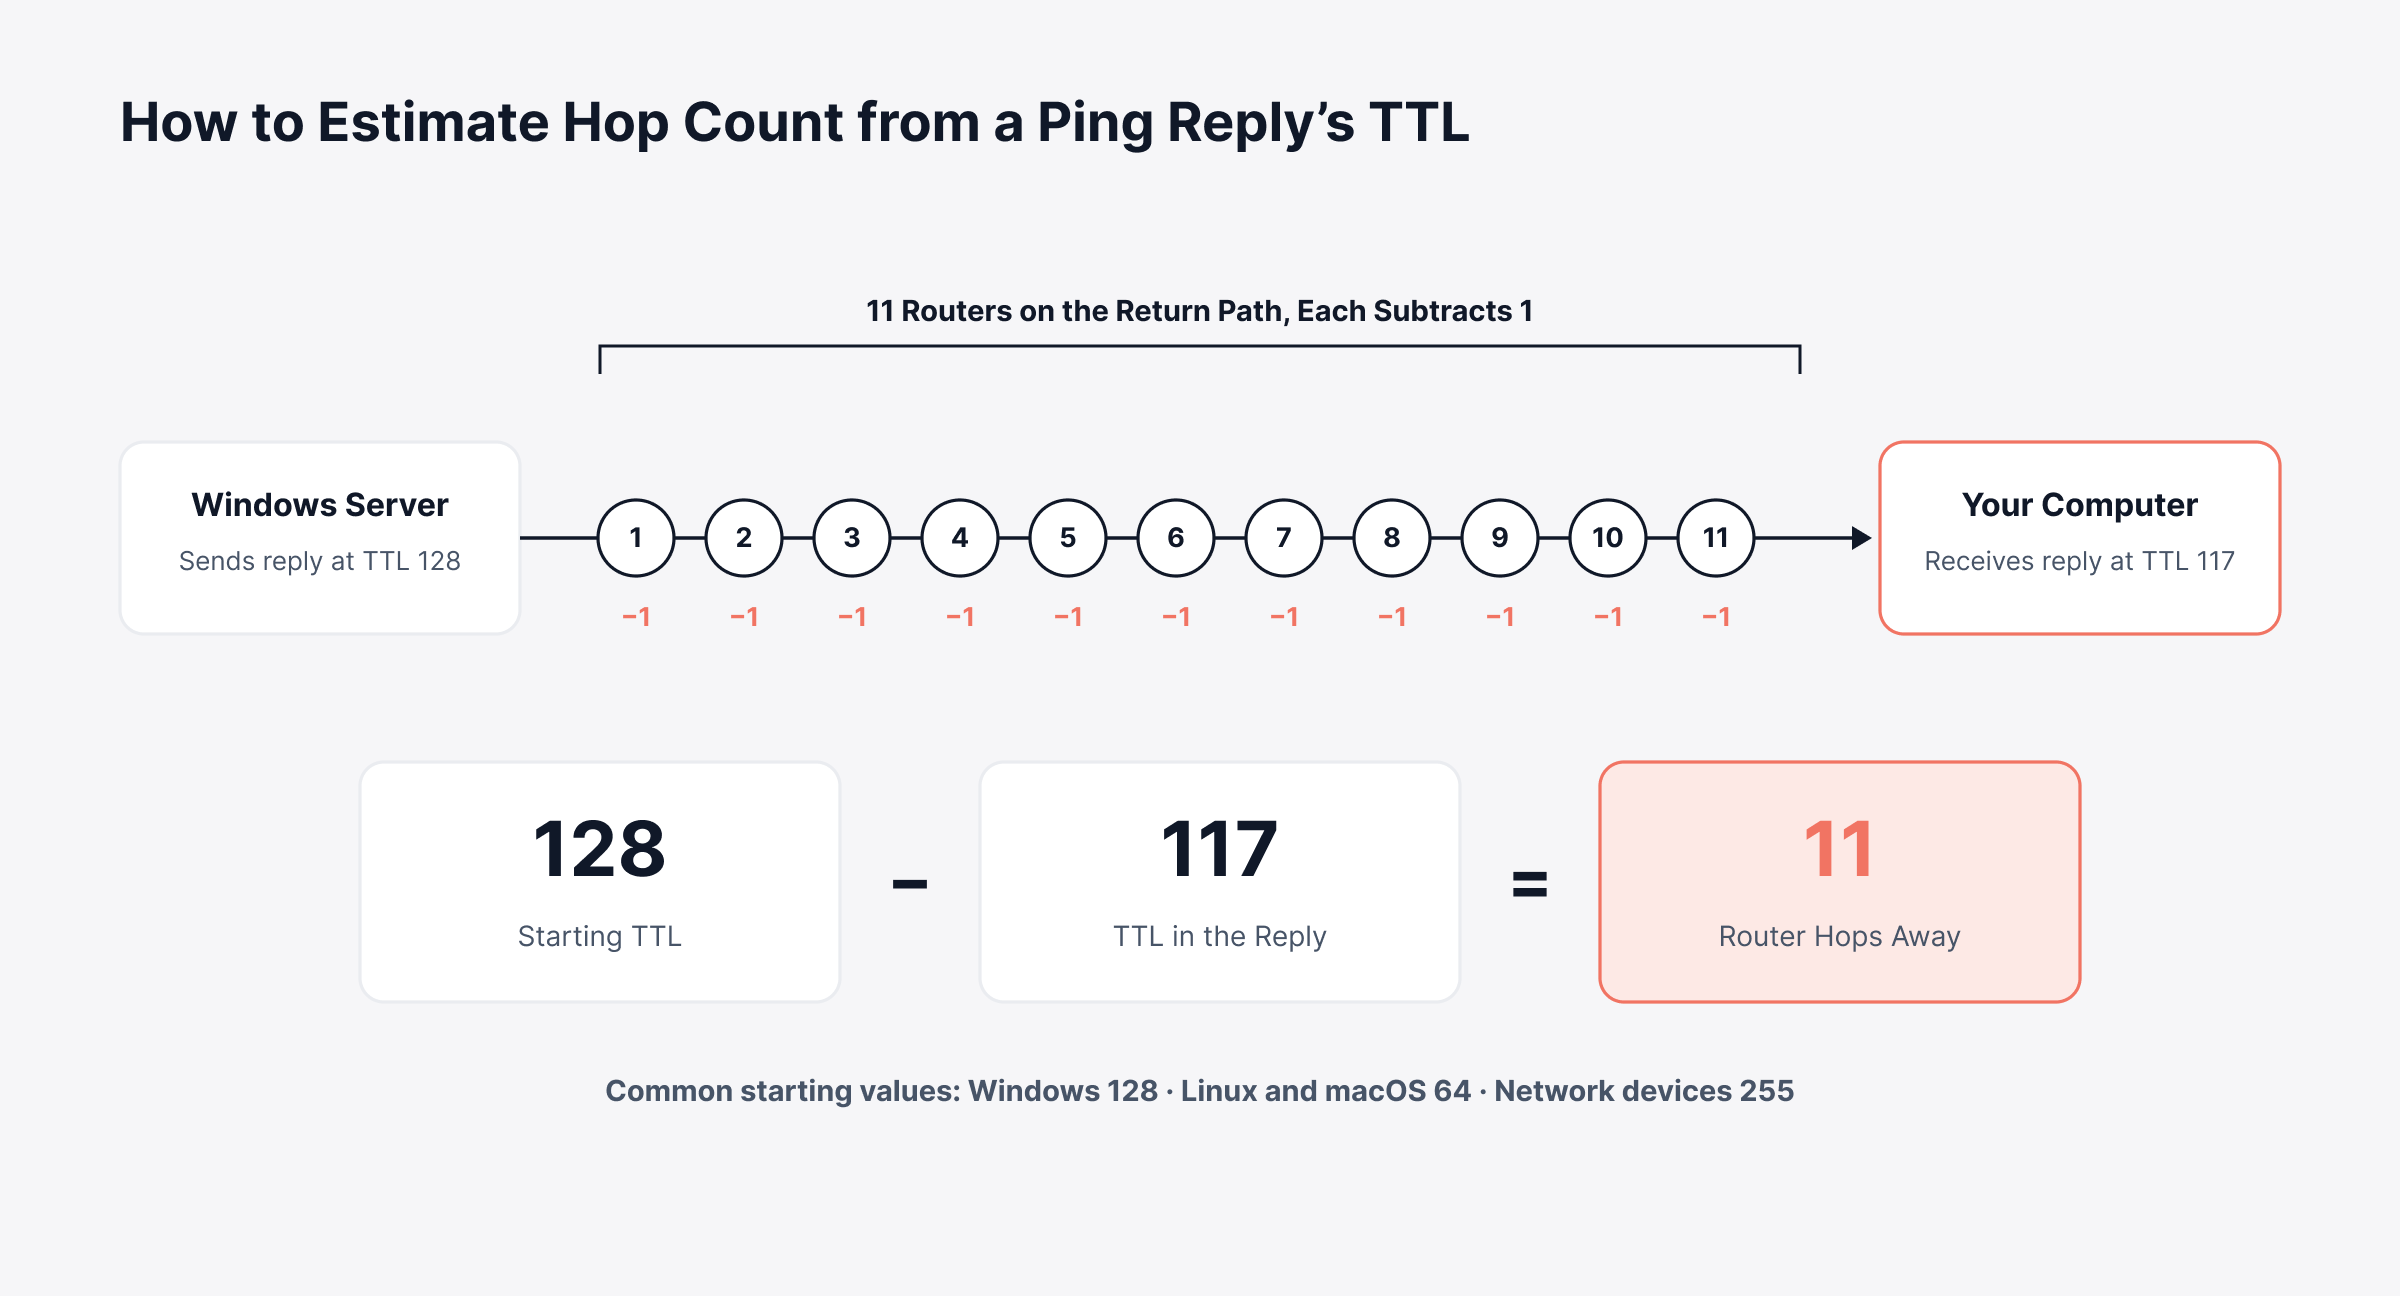
The TTL value in a reply is a countdown: How many more routers the reply was allowed to cross before being dropped. Each router knocks one off the count. At zero the packet is dropped, which keeps misrouted traffic from circling forever.
Because operating systems use predictable starting values, the TTL doubles as a rough distance gauge:
Windows hosts: Start at 128
Linux and macOS hosts: Start at 64
Many routers and network appliances: Start at 255
Take TTL=117. The nearest starting value above it is 128, so the reply most likely came from a Windows host 11 routers away. A sudden change in that number for a familiar destination means the route has changed, and every extra network hop can add delay.
Keep the three starting values in mind and the math takes seconds. The example below works through TTL=117 step by step.
How to Check Packet Loss Using Ping
To check packet loss using ping, send at least 100 requests and take the loss figure from the summary at the end. Short tests mislead. Intermittent loss slips straight past a four-packet run.
The pattern of the loss usually hints at the cause:
Steady low loss across every run: Often a faulty cable, duplex mismatch or degraded wireless signal
Loss in bursts: Usually congestion during busy periods or a device dropping traffic under load
Loss only on large packets: Points to an MTU problem on the path
Loss to one host but not its neighbors: Suggests the host itself, or a firewall rate-limiting ICMP
Voice and video calls feel packet loss before anything else does, even at low levels, and persistent loss on a business link deserves a look. Linux adds one more clue to the summary: The mdev figure shows how much reply times swing, an early hint of jitter.
What Counts as a Good Ping Result?
A good ping result is one that looks like that path's normal. Inside one building, expect single-digit milliseconds. Cross an ocean and 100 ms or more can be completely normal.
So compare against history. If a branch link has answered in 20 ms for months and suddenly needs 80, investigate, even though 80 ms on some other link would raise no concern. Errors are a different matter, since the exact wording of each one narrows the search.
What do Common Ping Errors Mean?
Common ping errors carry more information than their short wording suggests. The table lists the ones administrators run into most, alongside the usual cause and a sensible next check.
Error message | Likely cause | What to check next |
Request timed out | No reply within the timeout, from a down host, broken path or blocked ICMP | Ping the gateway, then confirm firewall rules |
Destination host unreachable, reply from your own IP | The target on your subnet did not respond at all | Check the target's power, cable and IP address |
Destination host unreachable, reply from a router IP | That router has no route to the destination | Review routing tables on that router |
Ping request could not find host | DNS could not resolve the hostname on Windows | Ping the IP directly, then test DNS |
Name or service not known | The Linux version of a DNS resolution failure | Check resolver settings and DNS server reachability |
General failure | Local adapter, driver, VPN client or security software issue | Check the local network adapter and its settings |
TTL expired in transit | A routing loop, or a TTL set too low | Run traceroute to find where the loop starts |
Packet needs to be fragmented but DF set | The packet is larger than the path MTU | Lower the packet size until replies return |
One Windows behavior often causes confusion. A "Destination host unreachable" reply is counted as received, and the summary can show 0% loss for a host that never answered at all.
Misreading an error also has a business cost. Sending a DNS fault to the internet provider, or a firewall issue to the server team, can add hours to an outage before the right person starts work.
What does "Ping Request Timed Out" Mean?
A ping request timed out message means nothing came back before the timer ran out, and on Windows that timer is four seconds. The host could be off. Equally, a link in the path may have failed, or a firewall may be quietly throwing ICMP away.
Narrow it down by pinging the hop before the target, usually its gateway or the switch it connects to. A reply there puts the fault on the last stretch of the path.
Why does Ping Fail When the Internet Works?
Ping often fails while browsing works because ICMP is a frequent target of security policy. Out of the box, Windows Defender Firewall generally turns away inbound echo requests. Plenty of corporate perimeters have firewall rules that do likewise, and cloud security groups tend to discard ICMP unless an administrator has opened it up.
Some public websites also ignore ping entirely while serving web traffic normally. Before declaring an outage, test the service itself with a port or HTTP check.
Ping Works but the Website is Down: What Next?
When ping works but the website is down, the good news is that the network path is fine. The trouble is further up the stack, in the web server, a closed port, an expired certificate, a bad DNS record or the code itself. The commands below test those layers directly.
Platform | Command | What it tells you |
Windows | Test-NetConnection example.com -Port 443 | Whether the HTTPS port accepts connections, run in PowerShell |
Linux or macOS | nc -zv example.com 443 | Whether the port is open, if netcat is installed |
All three | curl -I https://example.com | The HTTP status code the web server returns |
All three | nslookup example.com | Which IP address DNS returns for the name |
An unexpected address from nslookup points to DNS, and our guide to DNS troubleshooting walks through the fixes. A port that times out sends you to the service status, or to the load balancer in front of it. Where the cause still isn't obvious, a fixed sequence of tests usually exposes it.
How do You Troubleshoot Network Connectivity with Ping, Step by Step?
To troubleshoot network connectivity with ping, begin with the machine in front of you and move outward one layer at a time. Stop at the first failure. That is where the fault is, and you found it without guessing.
The six steps below follow that order:
Ping the loopback address: Confirms your own TCP/IP stack works
Ping your own IP address: Confirms the network adapter is configured correctly
Ping the default gateway: Confirms you can reach the local network and router
Ping a public IP address: Confirms internet routing works without relying on DNS
Ping a hostname: Confirms name resolution works
Test the specific service: Confirms the port or application responds
Say a sales manager at a regional office can't get email. Steps 1 to 4 all pass, and the mail server answers by IP but fails by name. That points to DNS, which the internal network administrator can correct without waiting on the internet provider.
Here are the commands, written in Windows syntax. Linux and macOS users should add -c 4, otherwise each test runs until stopped.
Step | Command | What it tells you |
1 | ping 127.0.0.1 | Your computer's network software is running |
2 | ping 10.0.0.25 | Your adapter holds a working IP address |
3 | ping 10.0.0.1 | Your local network and gateway respond |
4 | ping 203.0.113.10 | Traffic reaches the internet without DNS |
5 | ping example.com | DNS translates names into addresses correctly |
6 | Test-NetConnection example.com -Port 443 | The service itself accepts connections |
Before you can ping your IP address and gateway in steps 2 and 3, you have to look them up with ipconfig on Windows, ip addr and ip route on Linux, or ipconfig getifaddr en0 and route -n get default on macOS. One point trips people up: A private address such as 10.0.0.1 is reachable only from inside your network or over VPN. A public address is what tests the route to the internet.
Stick to this order and a complaint like "the network is slow" ends up as one specific fault. In the sequence below, every test has a matching place to look when it fails.
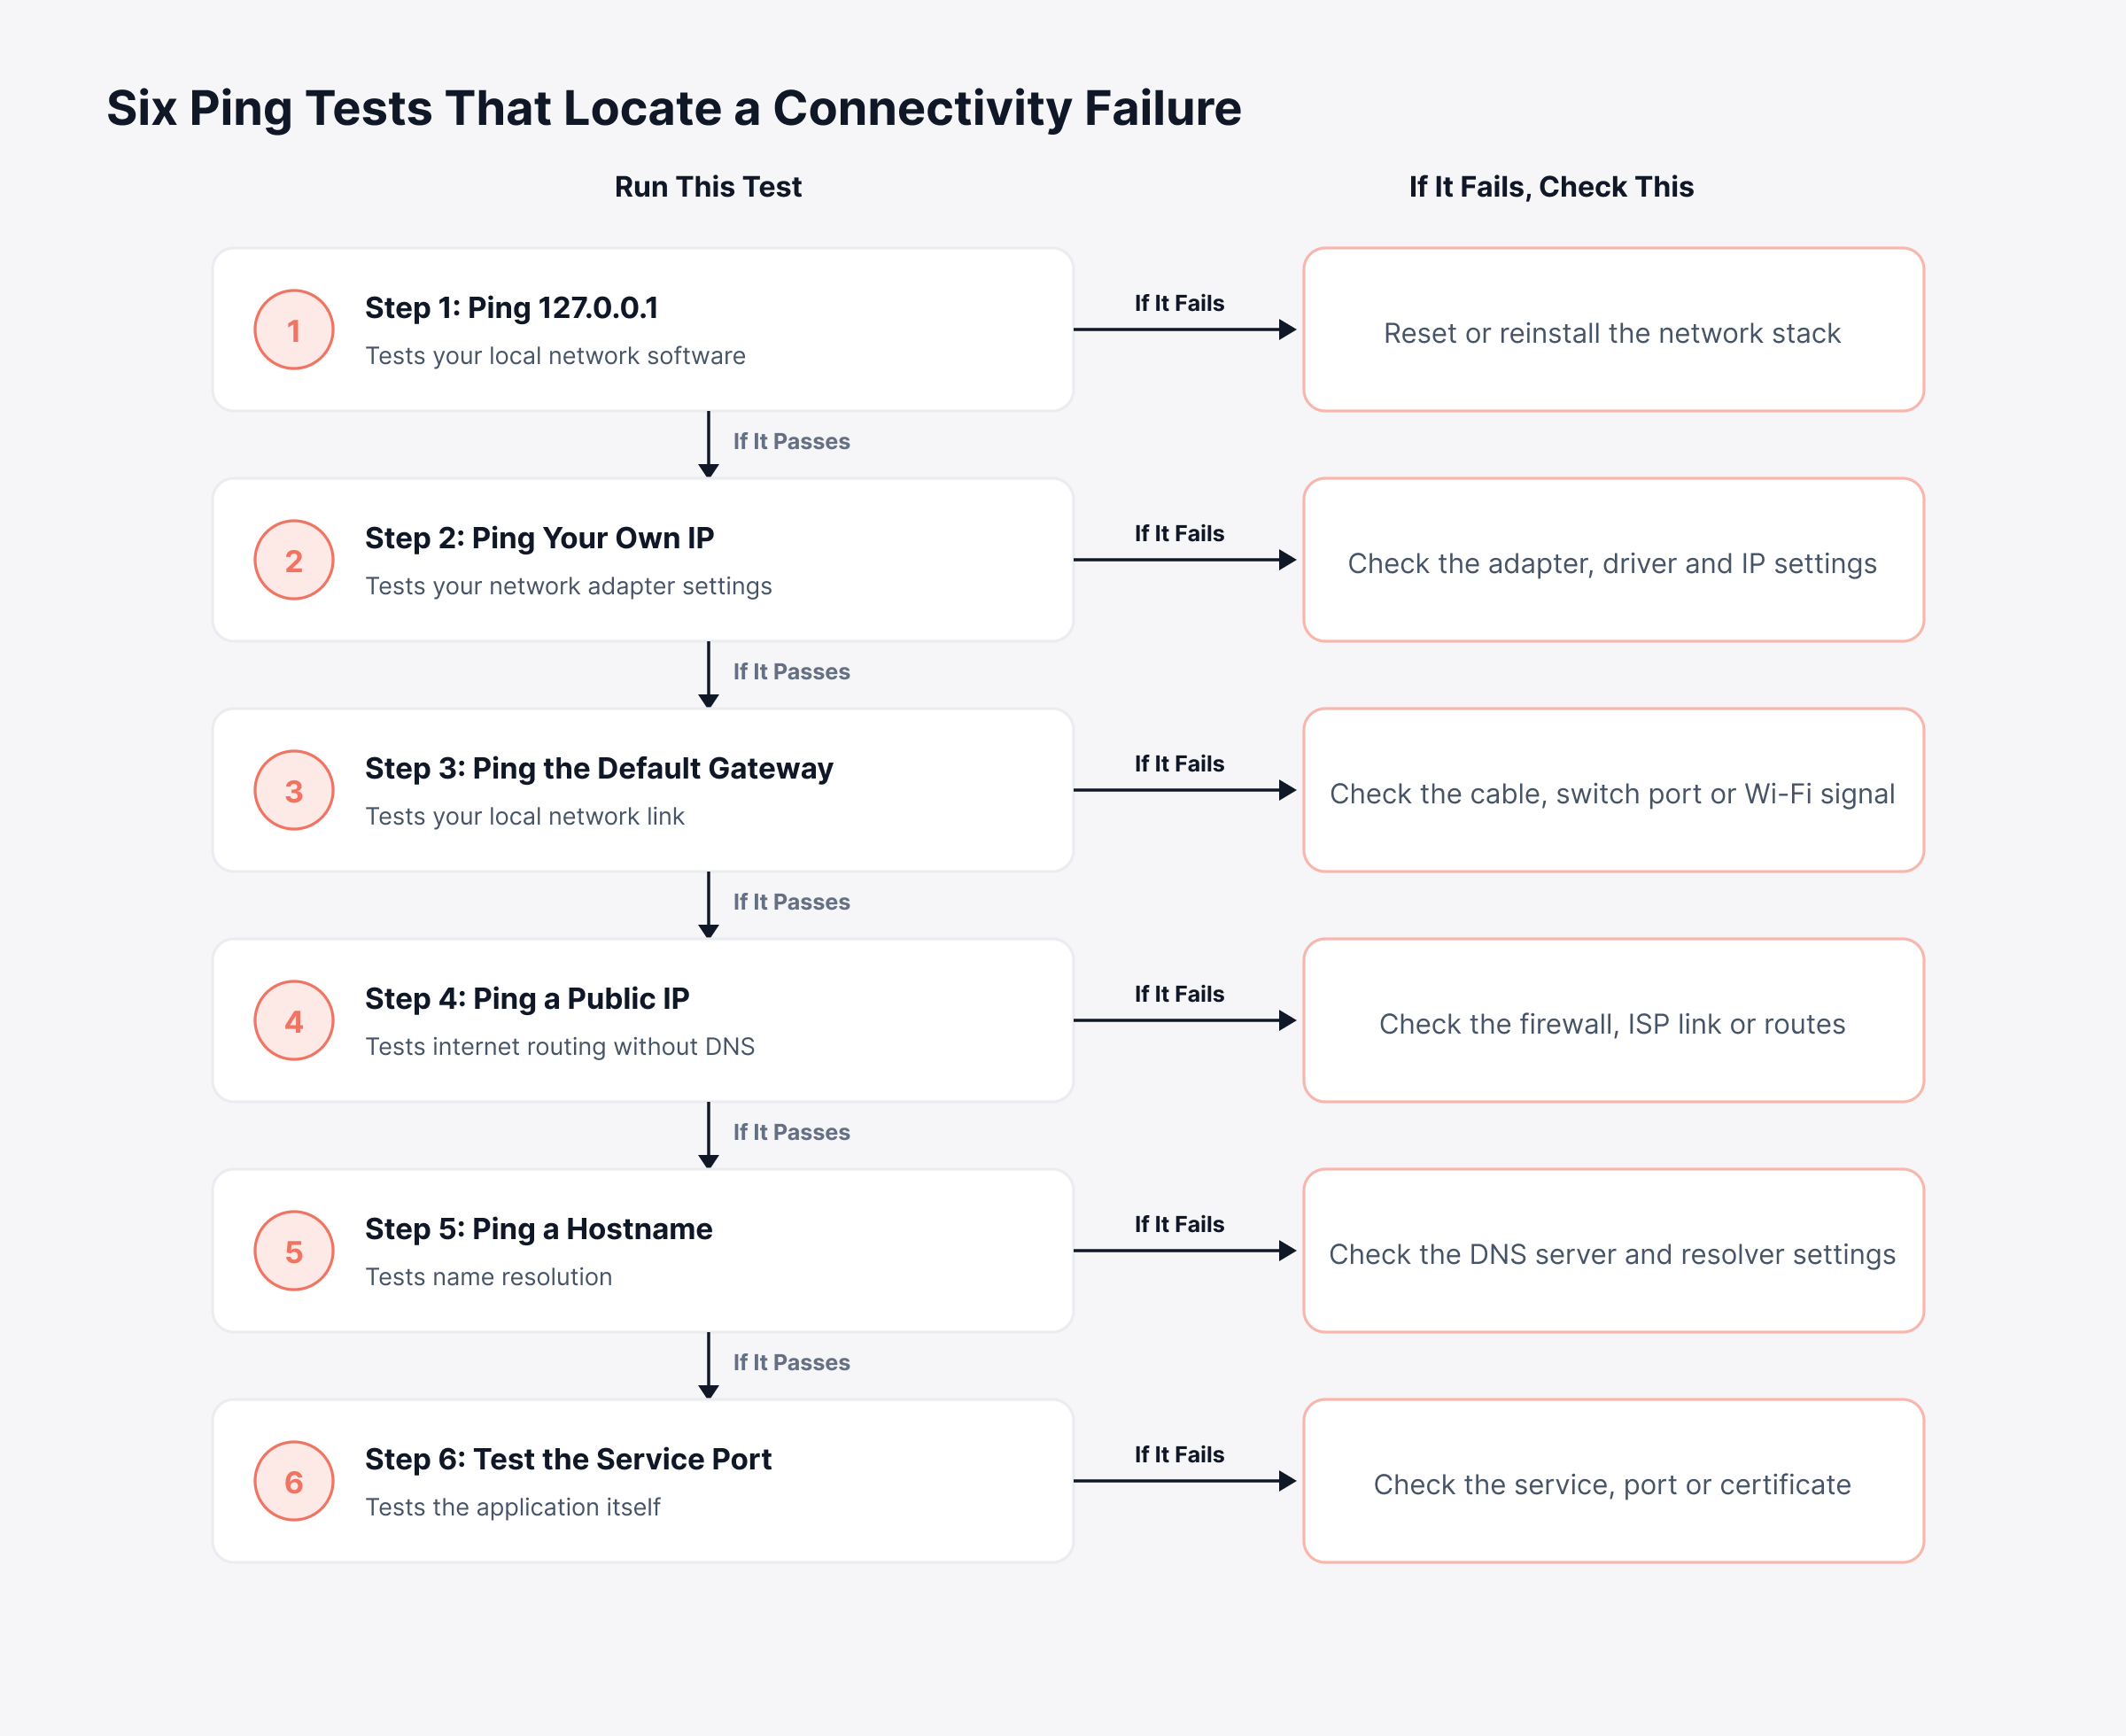
Whichever step fails, that's the part of the network to fix. For a broken path where the break point is unclear, traceroute shows the exact hop that goes quiet.
How do You Read Ping Output on Routers and Switches?
Ping output on Cisco IOS routers and switches swaps full reply lines for single characters. Running it from the router or switch shows what the network itself can reach, with no user laptop involved. Five 100-byte requests with a two-second timeout is the IOS default.
Every symbol in the output represents one request:
Symbol | What it means |
! | A reply was received |
. | The request timed out waiting for a reply |
U | A destination unreachable message came back |
Q | The destination asked the sender to slow down |
M | The packet could not be fragmented |
? | An unknown packet type came back |
& | The packet's lifetime was exceeded |
A result such as !!.!! means one of five requests went missing. A string of U characters means a router along the path is actively rejecting the traffic.
Network engineers often need to ping from a specific interface or with a larger sample. The IOS forms below handle both cases.
Command | What it tells you |
ping 10.0.0.10 repeat 100 | Sends 100 requests for a reliable loss reading |
ping 10.0.0.10 source Loopback0 | Tests the path from a chosen interface |
ping 10.0.0.10 size 1500 df-bit | Tests whether full-size packets cross unfragmented |
Enter ping with no address in privileged mode and IOS walks you through extended ping, asking for each option in turn. Syntax differs between platforms and software releases, so check it against your own devices. There are also times when a single target won't do and a whole range needs checking.
What is a Network Health Check Ping Command?
A network health check ping command loops through a range of addresses, pinging each once and showing you which ones respond. Administrators reach for it after a power cut or a maintenance window, to confirm everything is back.
Each of these sweeps a /24 subnet in a single pass:
Platform | Command | What it tells you |
Windows | for /L %i in (1,1,254) do ping -n 1 -w 200 10.0.0.%i | Which addresses from .1 to .254 reply |
Linux | for i in {1..254}; do ping -c 1 -W 1 10.0.0.$i; done | Which addresses from .1 to .254 reply |
For a small network and an occasional check, that's enough. Beyond that, the drawbacks pile up: Sweeps take minutes, the output is tedious to scan and the results vanish when you close the window. Past a certain number of devices and sites, automated checks on a fixed polling interval make far more sense.
Why is the Ping Command Not Enough for Network Observability at Scale?
The ping command gives you a snapshot taken by one person, from one location, at one moment. For diagnosis that's ideal, yet as the basis for day-to-day operations it falls short. Once hundreds of devices are spread over offices, data centers and cloud regions, five gaps open up in any manual or scripted approach:
Timing: A three-minute outage overnight leaves no trace by morning, so recurring faults stay unexplained and keep disrupting work
History: Without stored results, nobody can show whether performance is improving or whether a provider met its commitments
Vantage point: A ping from headquarters says nothing about how a branch reaches the same server, so remote sites wait longer for fixes
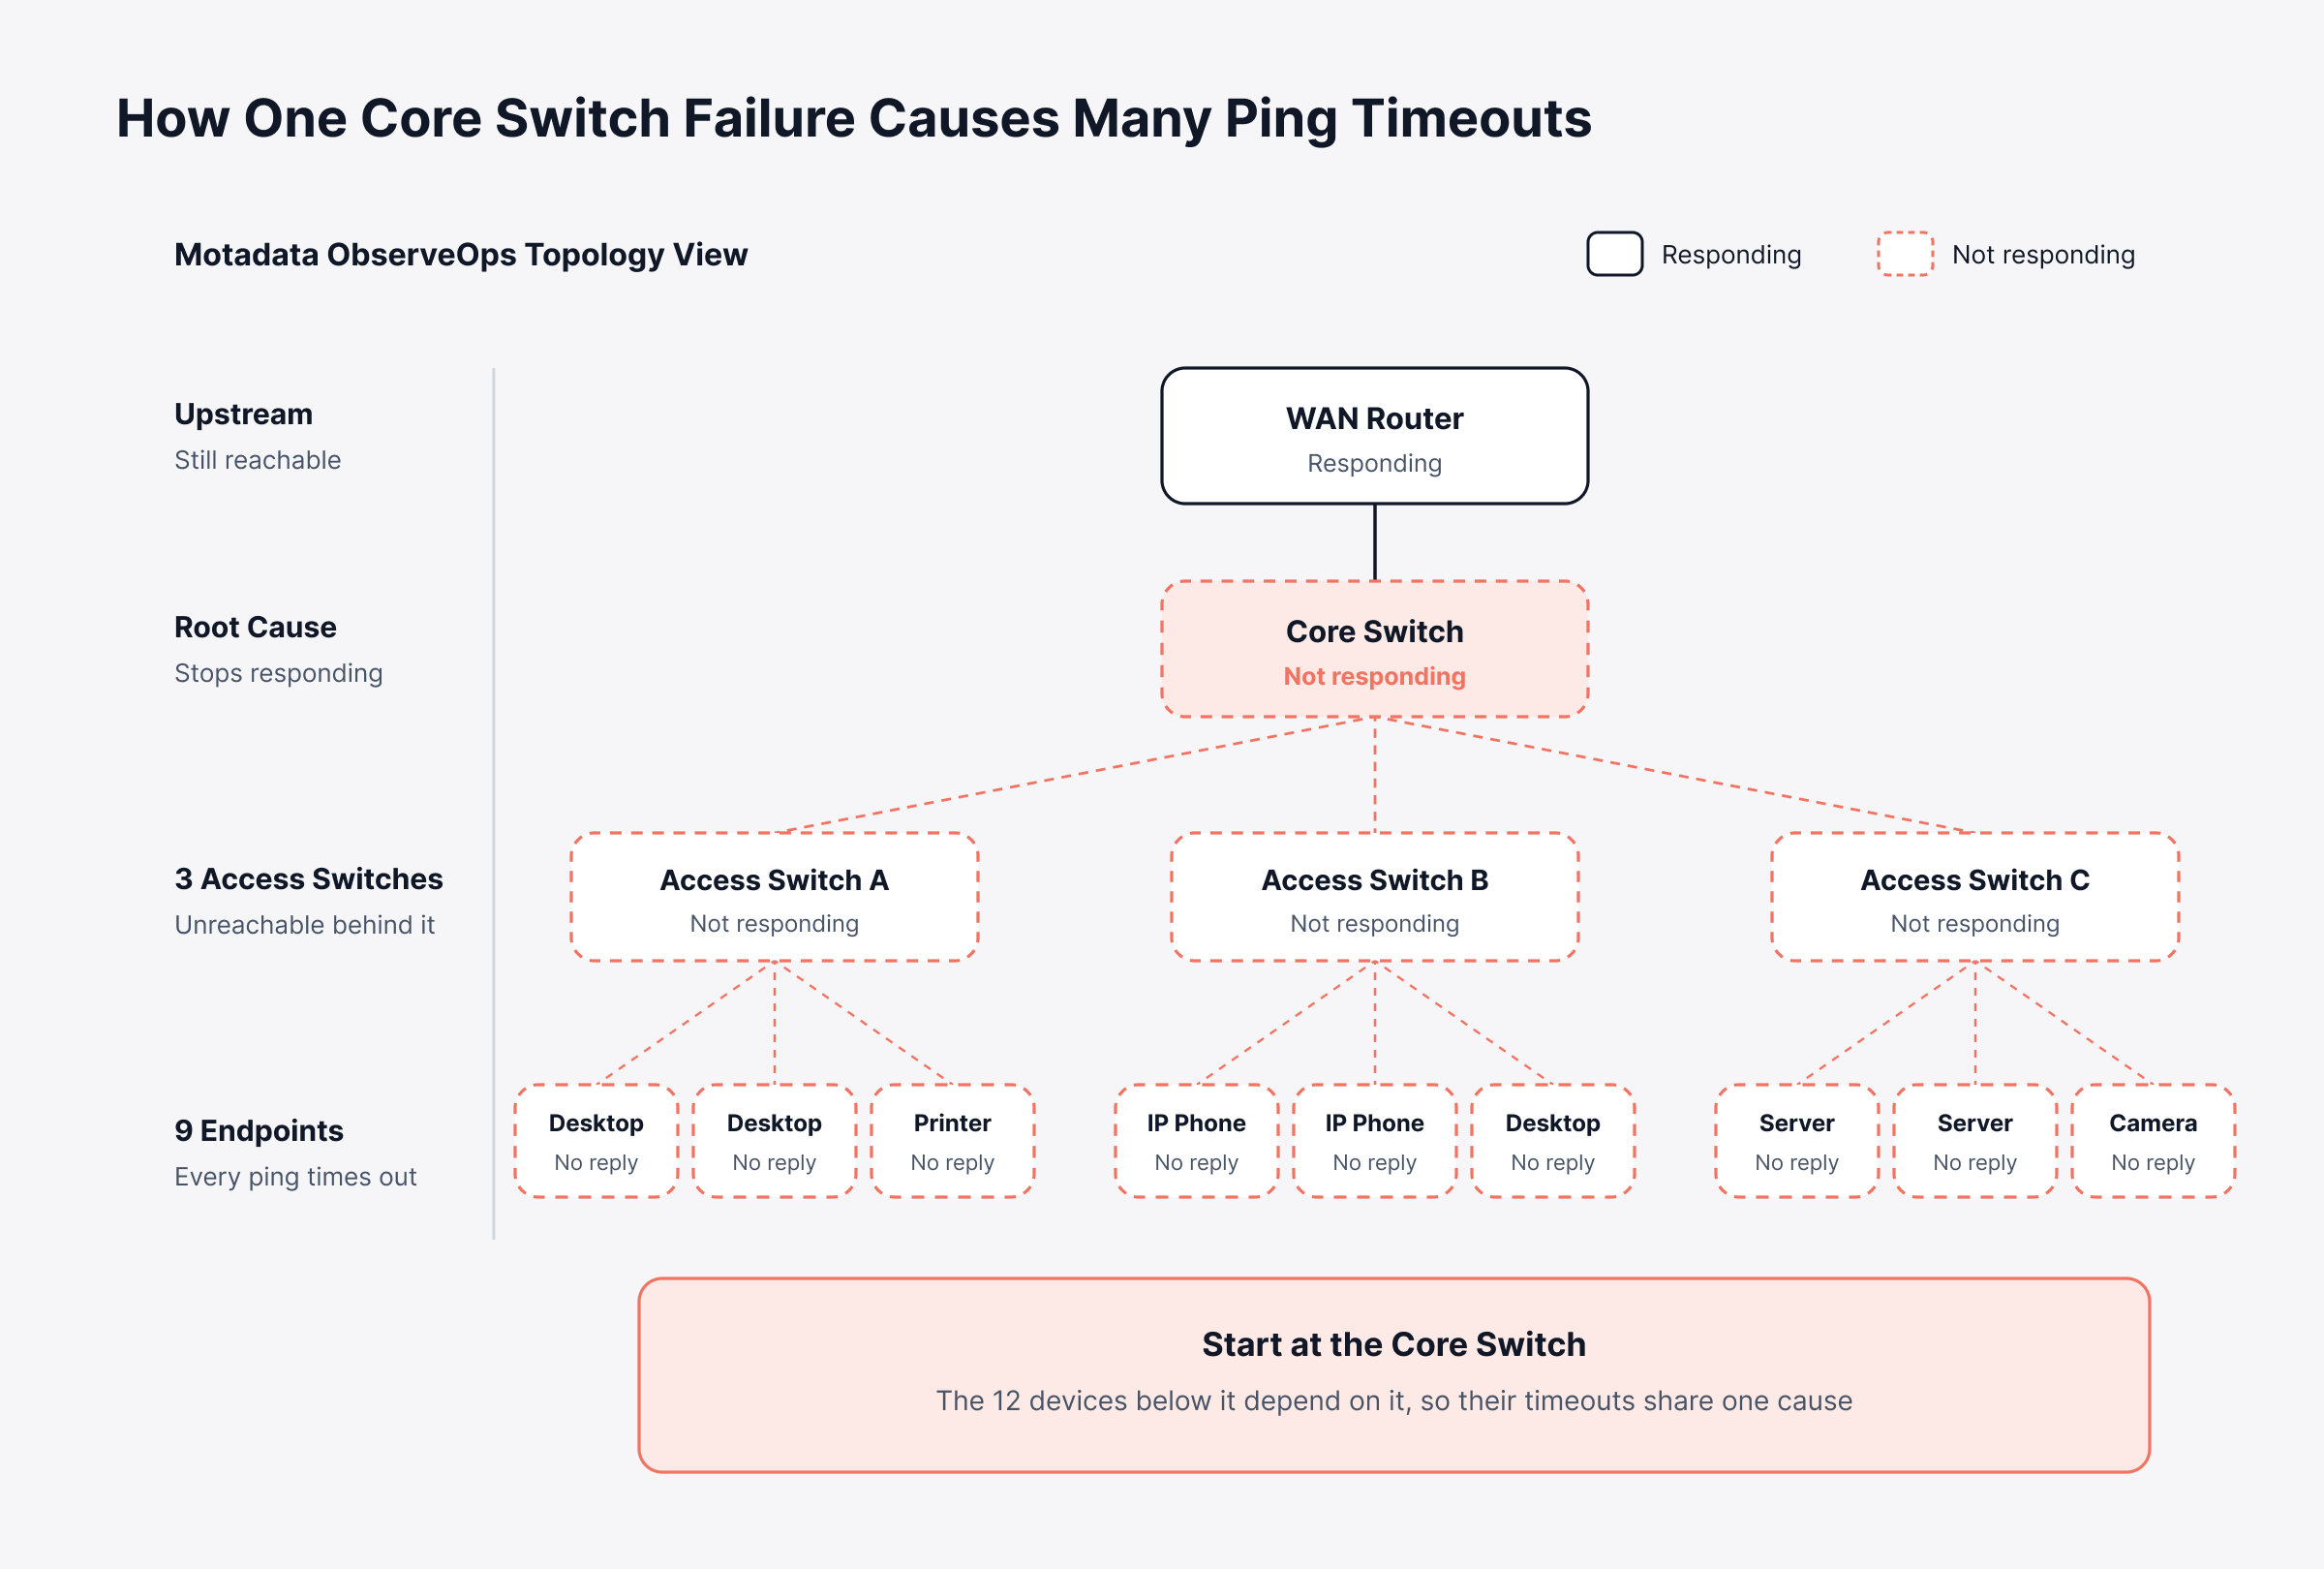
Context: When a core switch fails, every device behind it times out at once, and engineers spend the first part of the incident sorting symptoms from the cause
Coverage: ICMP reachability says nothing about ports, URLs or certificates, so customer-facing services can fail while every ping looks healthy
Consider what this looks like for a retail chain running 40 stores. One store's WAN link begins losing packets every evening as card payments settle, daytime pings look fine, and nobody hears about the failed transactions until morning. With continuous checks and stored history, the evening pattern would be visible after one night, giving the store solid evidence to put in front of its provider.
For the business, the expensive part is detection time: The stretch between something breaking and IT finding out. If spotting outages relies on a person typing a command, customers and staff usually get there first. Every minute of that delay adds to downtime costs and puts commitments at risk.
What Should IT Leaders Ask If Ping is Still the Main Availability Check?
Four questions help IT leaders decide whether ping-based checking still fits their environment:
Do we learn about outages from our own alerts, or from users and customers?
Can we show availability over the last quarter for every site and critical service?
How many engineer hours go into manual checks and sweeps each week?
Does each branch office have its own vantage point, or does everything get tested from headquarters?
Hesitate on any of these, and the environment has likely outgrown manual checks. Organizations that adopt proactive monitoring still use ping to diagnose problems. They simply stop asking people to do the repetitive checking.
How does Motadata ObserveOps Turn Ping into Continuous Network Observability?
Motadata ObserveOps turns the ping command into continuous network observability. Checks run on a schedule, every result is stored and compared against a learned baseline, and alerts arrive with topology context attached. You find problems sooner and keep a record that shows availability over time.
1. Scheduled Ping and Service Checks
Ping checks in ObserveOps run next to Port, URL, DNS and SSL Certificate checks, which puts reachability and service health side by side. Through its uptime assurance capability, devices are polled at sub-minute intervals. Interface up and down events are tracked too, including links that flap on and off.
Branch offices get their own Motadata Collectors, which run checks locally and send results back to the central platform. Each site is tested from its own vantage point, something no single administrator's laptop can offer.
2. Network Baselines That Catch Slow Degradation
Plenty of links keep answering ping while their performance slides. ObserveOps records latency, jitter and packet loss over time, and machine learning builds performance baselines from that history. Deviations are flagged before they reach a fixed threshold.
In practice, the branch link that creeps from 20 ms to 80 ms can raise a flag well before anyone complains about slow applications.
3. Topology Context for Every Availability Alert
Dozens of devices going silent at once raises an obvious question: Which failure came first? Topology mapping in ObserveOps places every availability event against the devices it depends on. Engineers can go straight to the upstream device.
Start with the device everything else depends on. In the topology below, a single core switch failure makes twelve downstream devices look broken at once.
4. Hop-by-Hop Path Visibility and Automated Diagnostics
Ping can confirm loss without saying where it happens. ObserveOps fills that in by tracing the hop-by-hop path and measuring latency and loss on each segment. New monitors come with ping and traceroute runbooks attached by default, and because alerts can trigger runbooks, diagnostic output can be gathered the moment a problem appears.
5. Availability Alerts and Service-Level Reports
An alert can notify the right people, run a remediation script or open a ticket in ServiceOps or another connected service desk. Availability reports cover daily, weekly, monthly and quarterly windows, which gives service-level reviews evidence to work from. Because real-time alerts are classified by severity, host and monitor group, a down link reaches the engineer responsible for it.
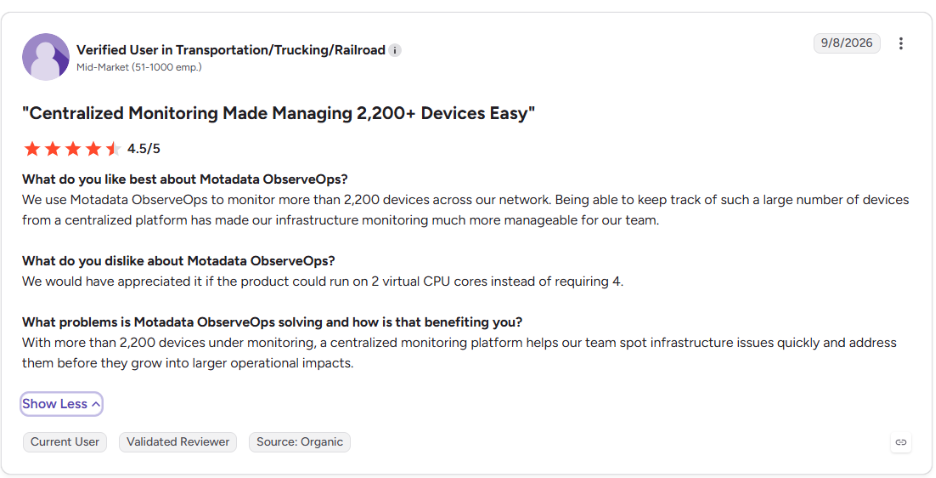
This is what one of our users says about Motadata ObserveOps on G2:
Move from Manual Ping to Continuous Observability with Motadata ObserveOps
The ping command is still the fastest first test when an incident starts, and no observability platform will replace a quick ping at the console. What it can't do is built into its design. It runs once, from one place, and keeps no record after the terminal closes.
Motadata ObserveOps runs those checks for you and adds what one command never could. With scheduled tests from every site, learned baselines, topology context, hop-level path data and availability reports, your organization gains a continuous record of network health. Outages show up as alerts, well before they show up as complaints.
FAQs
How do I ping my own IP address?
First find your address with ipconfig on Windows, ip addr on Linux or ipconfig getifaddr en0 on macOS. Then run ping followed by that address. A reply confirms your network adapter is configured and working, while a failure points to a driver, adapter or IP configuration problem on your own machine.
How do I run a 100 ping test?
On Windows, run ping -n 100 followed by the target address. On Linux and macOS, use ping -c 100 instead. The larger sample reveals intermittent packet loss that a four-packet test can miss, and the summary at the end shows the loss percentage and the spread of response times.
What is the difference between ping and traceroute?
Ping tells you whether a destination is reachable and how long the round trip takes. Traceroute lists every router along the path and the delay at each one, so it shows where a problem occurs. Motadata ObserveOps attaches ping and traceroute runbooks to new monitors by default, so both checks can run without opening a terminal.
Should ICMP be allowed through the firewall?
Most organizations allow ICMP echo requests from internal monitoring systems and trusted management networks while restricting them from the public internet. This keeps diagnostics and availability checks working without making hosts easy to find from the internet. Other ICMP message types, such as those used for path MTU discovery, should generally stay allowed.
How often should automated ping checks run?
Critical devices such as core switches, firewalls and WAN routers usually warrant checks every minute or less, while less critical endpoints can run on longer intervals. Platforms such as Motadata ObserveOps support sub-minute polling, so you can match the check frequency to how quickly each device's failure affects the business.
Author
Poonam Lalani
Content Strategist
Poonam Lalani is a B2B content strategist and writer with a background in computer engineering and experience across enterprise technology domains, including AI, cloud, DevOps, data engineering, and IT operations. She specializes in creating research-driven content that simplifies complex ideas and supports product education, thought leadership, and business growth.