Frontend Monitoring Metrics, Methods, and Tools That Protect Conversions
What do you do when a customer says the checkout button stopped responding, but every server dashboard says the application is fine? The API responded quickly and the logs show nothing unusual. Meanwhile, that customer has left without paying.
These days, the browser runs a big share of the application. The page itself is assembled on the customer's phone or laptop, and every click is handled there too, on whatever network they happen to be using. Once the response leaves the data center, server-side tools have nothing more to report.
Frontend monitoring watches that last stretch, using the same field data behind real user monitoring. In this blog, you will see how it works in the browser and which metrics to watch. We'll then connect it to backend traces through frontend observability and close with a rollout plan that protects customer data.
What is Frontend Monitoring?
Frontend monitoring is how you measure what happens in the browser after the server has replied. You may also hear it called front end monitoring or browser monitoring. Industry analysts usually place it within digital experience monitoring, a wider category that covers the user's experience on every digital channel.
Typical questions it answers include:
Speed: Did the main content appear quickly on this user's device and network?
Responsiveness: When the user clicked or typed, did the page react without a noticeable delay?
Stability: Did the layout stay put, or did buttons jump as late content loaded?
Correctness: Did any script fail, and did that failure stop the user from finishing a task?
Completion: Did the session reach its goal, such as a submitted form or a paid order?
What is the Difference Between Frontend Monitoring and Frontend Observability?
The difference is mostly about depth: frontend monitoring alerts you that something went wrong in the browser, and frontend observability gives you the detail to figure out what caused it. That's possible because front end observability stores enough detail with every session to answer questions no one planned for.
That context usually includes:
Who was affected: Device, browser, network, and location for every session
What changed: The release version that was live when the problem started
Where the time went: The backend trace behind a slow click or a failed request
That detail becomes far more valuable once the browser data can be linked with the backend systems behind it. This wider approach is known as full-stack observability, and it lets you read frontend, application and infrastructure data in one place.
How is Frontend Monitoring Different from Backend Monitoring?
Frontend monitoring tracks what the user sees and feels, whereas backend monitoring tracks the servers and services that deliver the page. Most investigations end up needing both, since the cause of a slow page could just as easily be a database query as a script that's too heavy for the browser.
Dimension | Frontend monitoring | Backend monitoring |
Where data is collected | The user's browser, on their device and network | Servers, containers, databases, and services |
What it measures | Rendering speed, input delay, layout shifts, client errors, journeys | Response time, throughput, resource use, server errors |
Typical owner | Frontend engineering and digital product | SRE, platform, and application engineering |
Main blind spot | Why a backend call was slow | What the user saw after the response left |
For backend coverage, organizations usually turn to application performance monitoring, which traces each request across services and into the code itself. Frontend monitoring starts where that trace ends.
Why does Frontend Monitoring Matter to the Business?
Frontend monitoring matters because sales and sign-ups happen in the browser, which is exactly the layer server metrics miss. When a page stalls, people rarely complain. They simply leave.
You'll usually feel the impact in four places:
Revenue journeys: Checkout, quote, and onboarding flows fail quietly when a client-side error blocks a button
Support load: Vague complaints such as "the site is slow" take hours to reproduce without session data
Release confidence: A deployment can pass every server check and still break one browser version
Search visibility: Google uses Core Web Vitals as one of its page experience signals, so slow templates can affect organic reach
Take a hypothetical retailer that pushes a new version of its payment widget. Server response times stay flat, yet a JavaScript error now fires only on an older mobile browser and the "Pay now" button never activates.
With frontend error tracking, that error spike shows up within minutes of the release. Without it, the first clue might be a dip in orders days later. How fast you catch it comes down to how the monitoring collects and moves data.
How does Frontend User Monitoring Work?
Frontend user monitoring works by loading a small JavaScript agent with each page. Using standard browser APIs, it notes timings, errors and clicks, and then sends the data away to be analyzed. In effect, it's a small telemetry pipeline that runs beside your application and leaves its behavior untouched.
In practice, there are five stages:
Instrument: A lightweight script or framework package loads early in the page, before most application code
Capture: Browser APIs such as PerformanceObserver report paint and layout events, while error handlers catch uncaught exceptions and rejected promises
Transmit: Events are batched and sent with the Beacon API when the page is hidden, so data survives tab closes without slowing navigation
Process: The backend groups similar errors, maps minified code back to source files, and calculates percentiles per page and segment
Correlate and alert: Sessions are linked to backend traces, compared against thresholds, and routed to the people who own the affected page
Map these stages to owners before you choose a tool, since each one can fail independently. The flow below separates what the browser collects from what the monitoring platform turns it into.
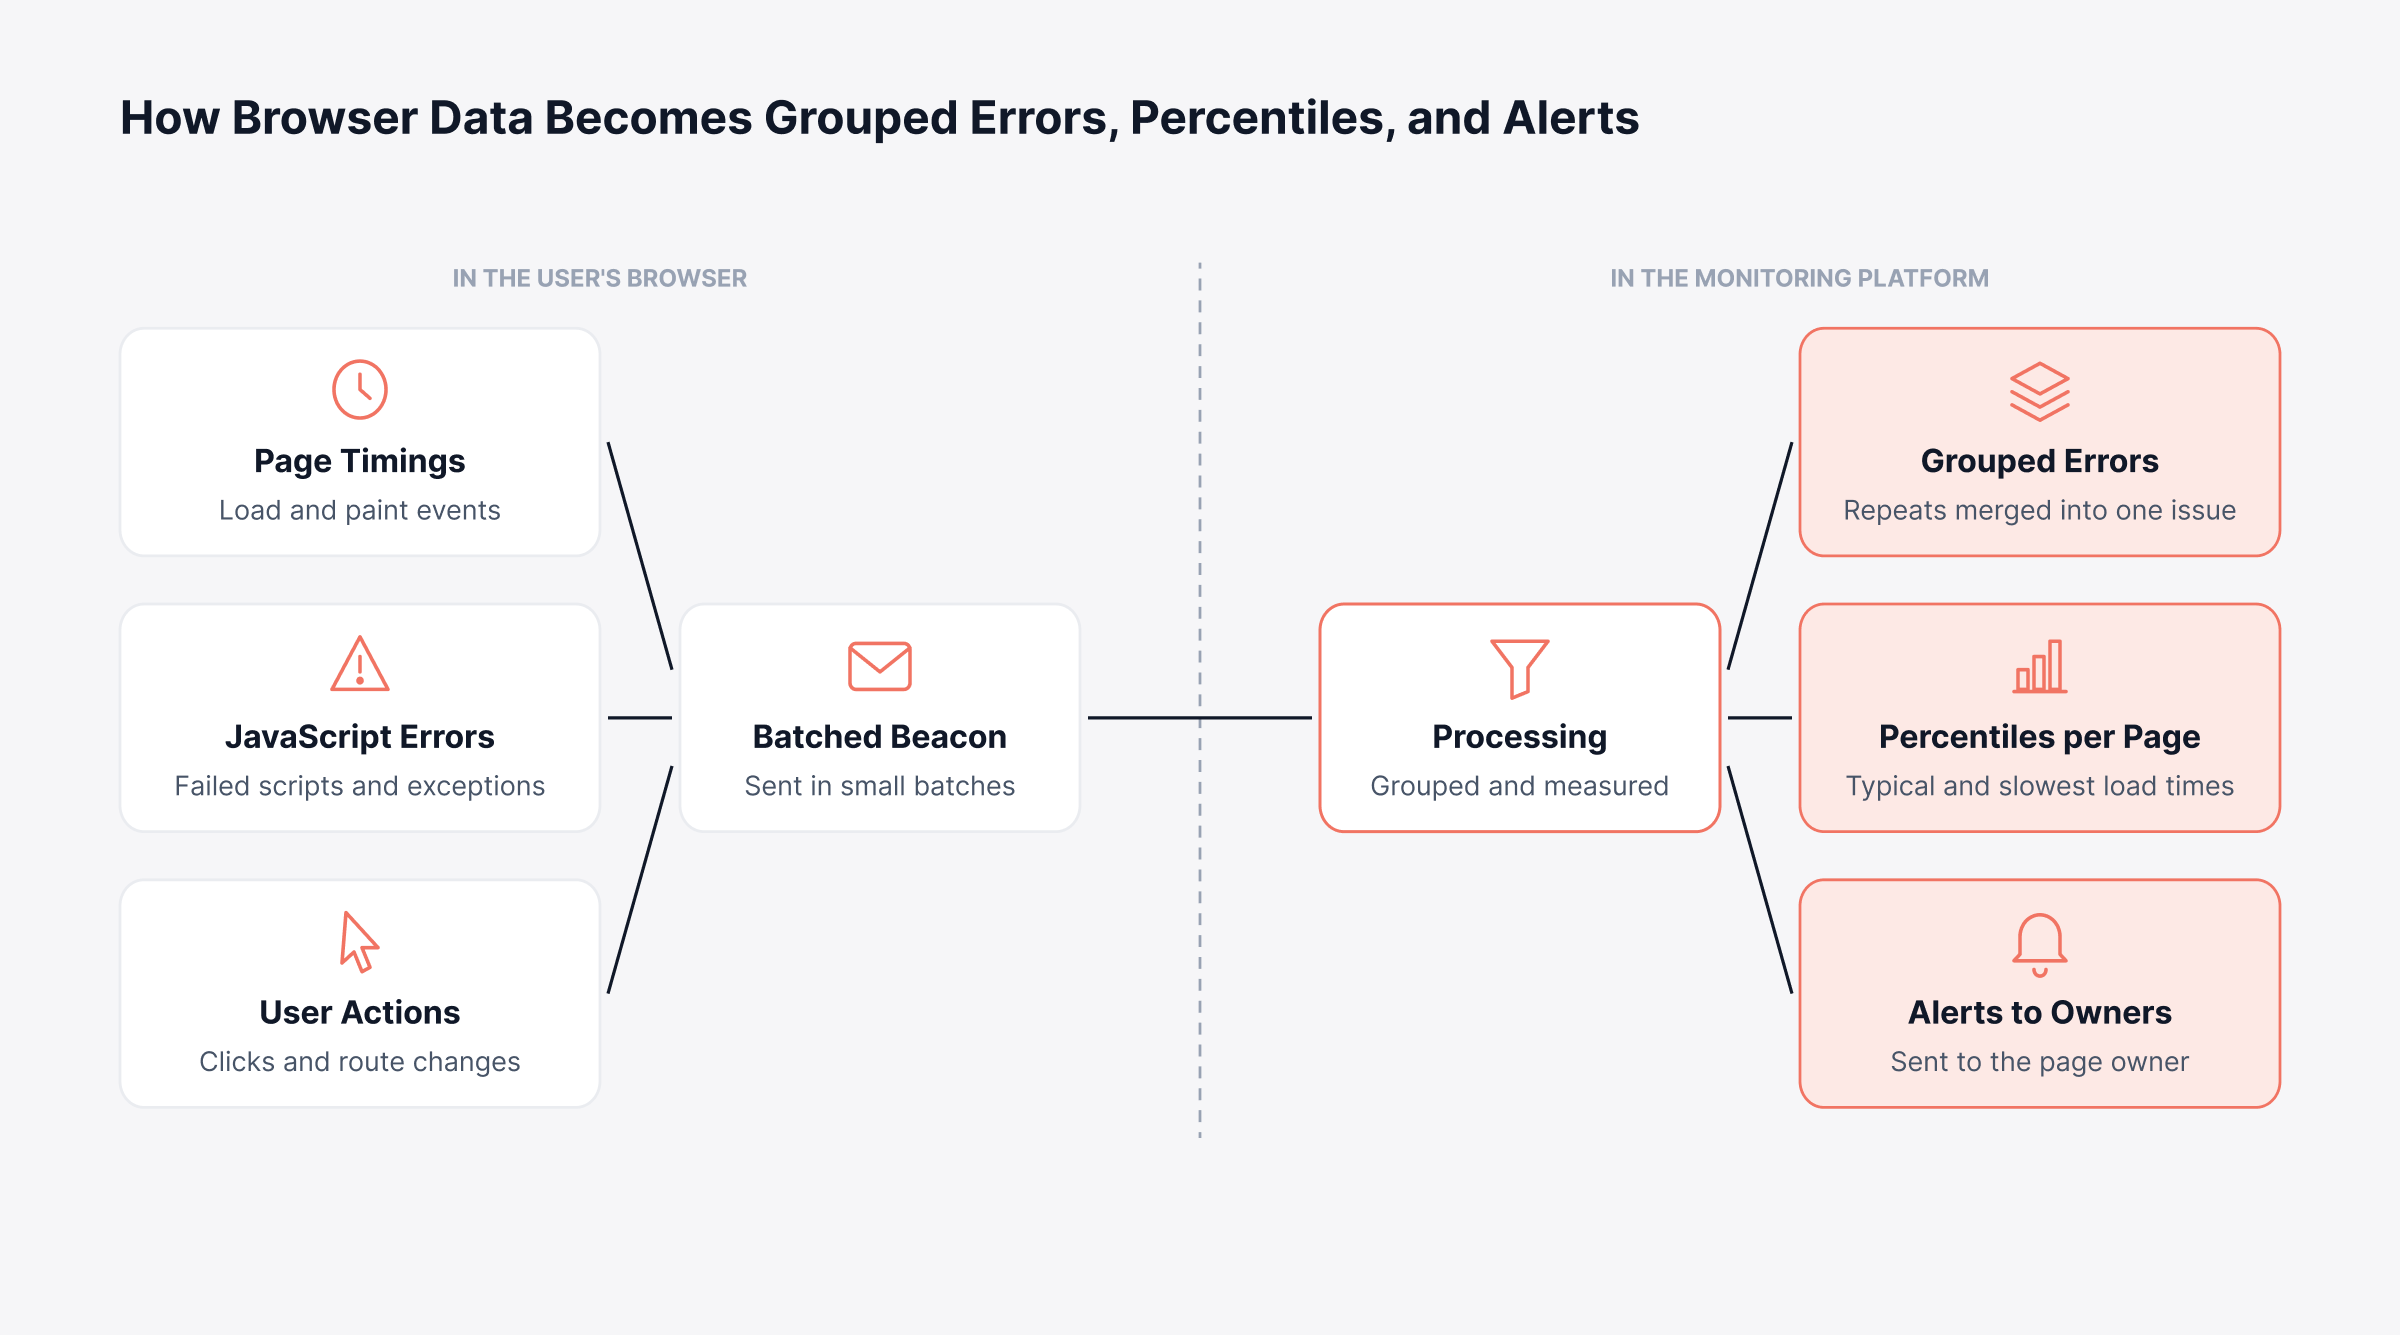
That pipeline carries the data. What you actually learn from it depends on the methods feeding it.
What are the Main Methods of Frontend Monitoring?
Frontend monitoring relies on five methods, each built to answer its own question about the user experience. Mature programs end up running all five, usually added one at a time.
1. Real User Monitoring (RUM)
Real user monitoring quietly records data from every visitor, and it forms the base of frontend performance monitoring. You see how the application holds up on the hardware and connections your customers actually use.
Its strength is coverage of conditions nobody would think to test. The catch is that it only reports on pages people have already visited. That's why most programs pair it with scheduled tests, which our RUM vs synthetic comparison covers in more detail.
2. Synthetic Monitoring
Synthetic monitoring sends scripted test browsers through key journeys on a fixed schedule. The script doesn't wait for traffic. So a broken login overnight gets caught before the morning rush.
Synthetic checks also suit the critical APIs behind each page. If you're weighing options for that layer, a roundup of API monitoring tools helps, because API and browser checks tend to share one alerting path.
3. Frontend Error Tracking
Frontend error tracking catches script exceptions and failed resource loads in live sessions, then folds repeats into one issue. That grouping matters. A single broken component can throw thousands of identical reports within the hour.
To get from a stack trace to a fix, a developer needs context, and good JavaScript error tracking supplies it:
Source maps: Map minified production code back to the original file and line, ideally uploaded privately during the build
Release tags: Attach the deployment version to every event so a new error links straight to the change that introduced it
Session context: Show the page, browser, and steps that came before the failure
Noise filters: Drop errors from browser extensions, bots, and known harmless warnings so genuine regressions stand out
4. Session Replay
Session replay lets an engineer play back a visit and see each step that came before a failure. It shortens the time spent reproducing vague bug reports.
Replay also raises the biggest privacy concern of the five, since it can capture what people type. So settle masking rules with your security and compliance leads first, then turn on session replay for any payment or identity form.
5. Frontend Logging
Frontend logging records structured events from the browser, like a failed retry or a fallback the code took. Metrics and errors don't explain those decisions. In large single-page applications, logs often do.
Handle browser logs the way you'd handle server logs:
Structure: Send key-value fields that follow one consistent schema
Levels: Keep debug output out of production and reserve warnings for conditions someone will act on
Batching: Flush logs with the Beacon API when the page is hidden instead of sending one request per line
Scrubbing: Remove email addresses, tokens, and query string values before anything leaves the device
Which Frontend Monitoring Method Answers Which Question?
Where should frontend monitoring begin? Start with whichever method answers your most pressing question.
Method | Question it answers | Data source | When it runs |
Real user monitoring | How fast and stable is the site for actual visitors? | Every user session | Continuously, with live traffic |
Synthetic monitoring | Does a critical journey still work right now? | Scripted test browsers | On a schedule, even with no traffic |
Frontend error tracking | Which code is failing, and since which release? | Exceptions in user sessions | Whenever an error fires |
Session replay | What did the user do before the problem? | Recorded session events | Per session, usually sampled |
Frontend logging | What did the application decide along the way? | Structured client events | Wherever developers instrument |
Whatever mix you choose, the results come back to a short list of performance metrics.
Which Frontend Performance Metrics Should You Track?
Frontend performance monitoring focuses on a short list of metrics, and the three Core Web Vitals lead it. Tracking everything the browser exposes usually leads to acting on nothing.
Google publishes these thresholds in its web.dev guidance and judges each one at the 75th percentile of page loads. Mobile and desktop are scored separately. One change to note: Interaction to Next Paint took over from First Input Delay on March 12, 2024.
Metric | What it measures | Good | Needs improvement | Poor | What users feel when it is poor |
Largest Contentful Paint (LCP) | Time until the main content appears | 2.5s or less | Up to 4.0s | Over 4.0s | A blank or half-loaded page, and more early exits |
Interaction to Next Paint (INP) | Delay between a user action and the visual response | 200ms or less | Up to 500ms | Over 500ms | Buttons that feel stuck, so users click again or give up |
Cumulative Layout Shift (CLS) | How much visible content moves unexpectedly | 0.1 or less | Up to 0.25 | Over 0.25 | Mis-taps when a button moves as content loads |
First Contentful Paint (FCP) | Time until the first text or image renders | 1.8s or less | Up to 3.0s | Over 3.0s | A page that looks unresponsive after a click |
Time to First Byte (TTFB) | Time until the browser receives the first byte | 0.8s or less | Up to 1.8s | Over 1.8s | Every later step starting late |
Web Vitals monitoring tracks this field data page by page, around the clock. Three more signals fill in what the vitals leave out:
Error-free session rate: The share of sessions that finished without a JavaScript error
Long tasks: Main-thread work over 50 milliseconds, a leading cause of a sluggish INP
User satisfaction score: An Apdex score that rolls load times into one figure stakeholders can follow
Our RUM metrics guide goes through the full catalog and how to read each one.
Why do Percentiles Matter More Than Averages in Frontend Performance?
Why use percentiles? Because an average smooths over exactly the slow sessions where people tend to give up, and a page can look fine on paper while visitors on older mid-range phones wait twice as long.
Start with the 75th percentile, which gives a fair picture of what most visitors experience. If complaints keep coming from one region or one type of device, look further out in the tail with p99 latency.
How Should You Segment Browser Performance Monitoring Data?
Browser performance monitoring becomes far more useful when you break the data down by the ways your users differ, since an overall average seldom shows where to start.
These are the dimensions worth splitting by first:
Device class: Low-memory phones expose heavy JavaScript first
Network type: Slow mobile connections stretch LCP and TTFB
Geography: Distance to the nearest edge server changes load times by region
Page template: Checkout, search, and product pages fail for different reasons
Release version: A new deployment often explains a sudden shift
RUM segmentation keeps each of these slices saved, which makes it easy to compare them week over week. Then a vague slowdown turns into a named segment with an owner.
How does Frontend Observability Connect Browser Data to Backend Traces?
Frontend observability puts a trace ID in each request header, so a browser session and the backend calls it made stay linked. One investigation then covers both sides. Without that link, each side investigates its own half of the problem, and the customer waits longer for a fix.
For this, most tools rely on the W3C Trace Context standard and its traceparent header. The browser adds it to every API call it makes, and each backend service records its own work under that same ID as the request passes through. In production, three settings decide whether the link survives:
Cross-domain permission: An API on another domain must explicitly allow the traceparent header through its CORS settings, or the browser blocks the call
Propagation scope: Send trace headers only to your own domains, since third-party services may reject them and do not need your identifiers
Timing detail: Assets served from other domains share full timing data only when that server sends a Timing-Allow-Origin header
Confirm that trace headers survive every hop before you rely on correlation during an incident. The waterfall below spells out how one shared trace ID separates browser wait time from the backend span that caused it.
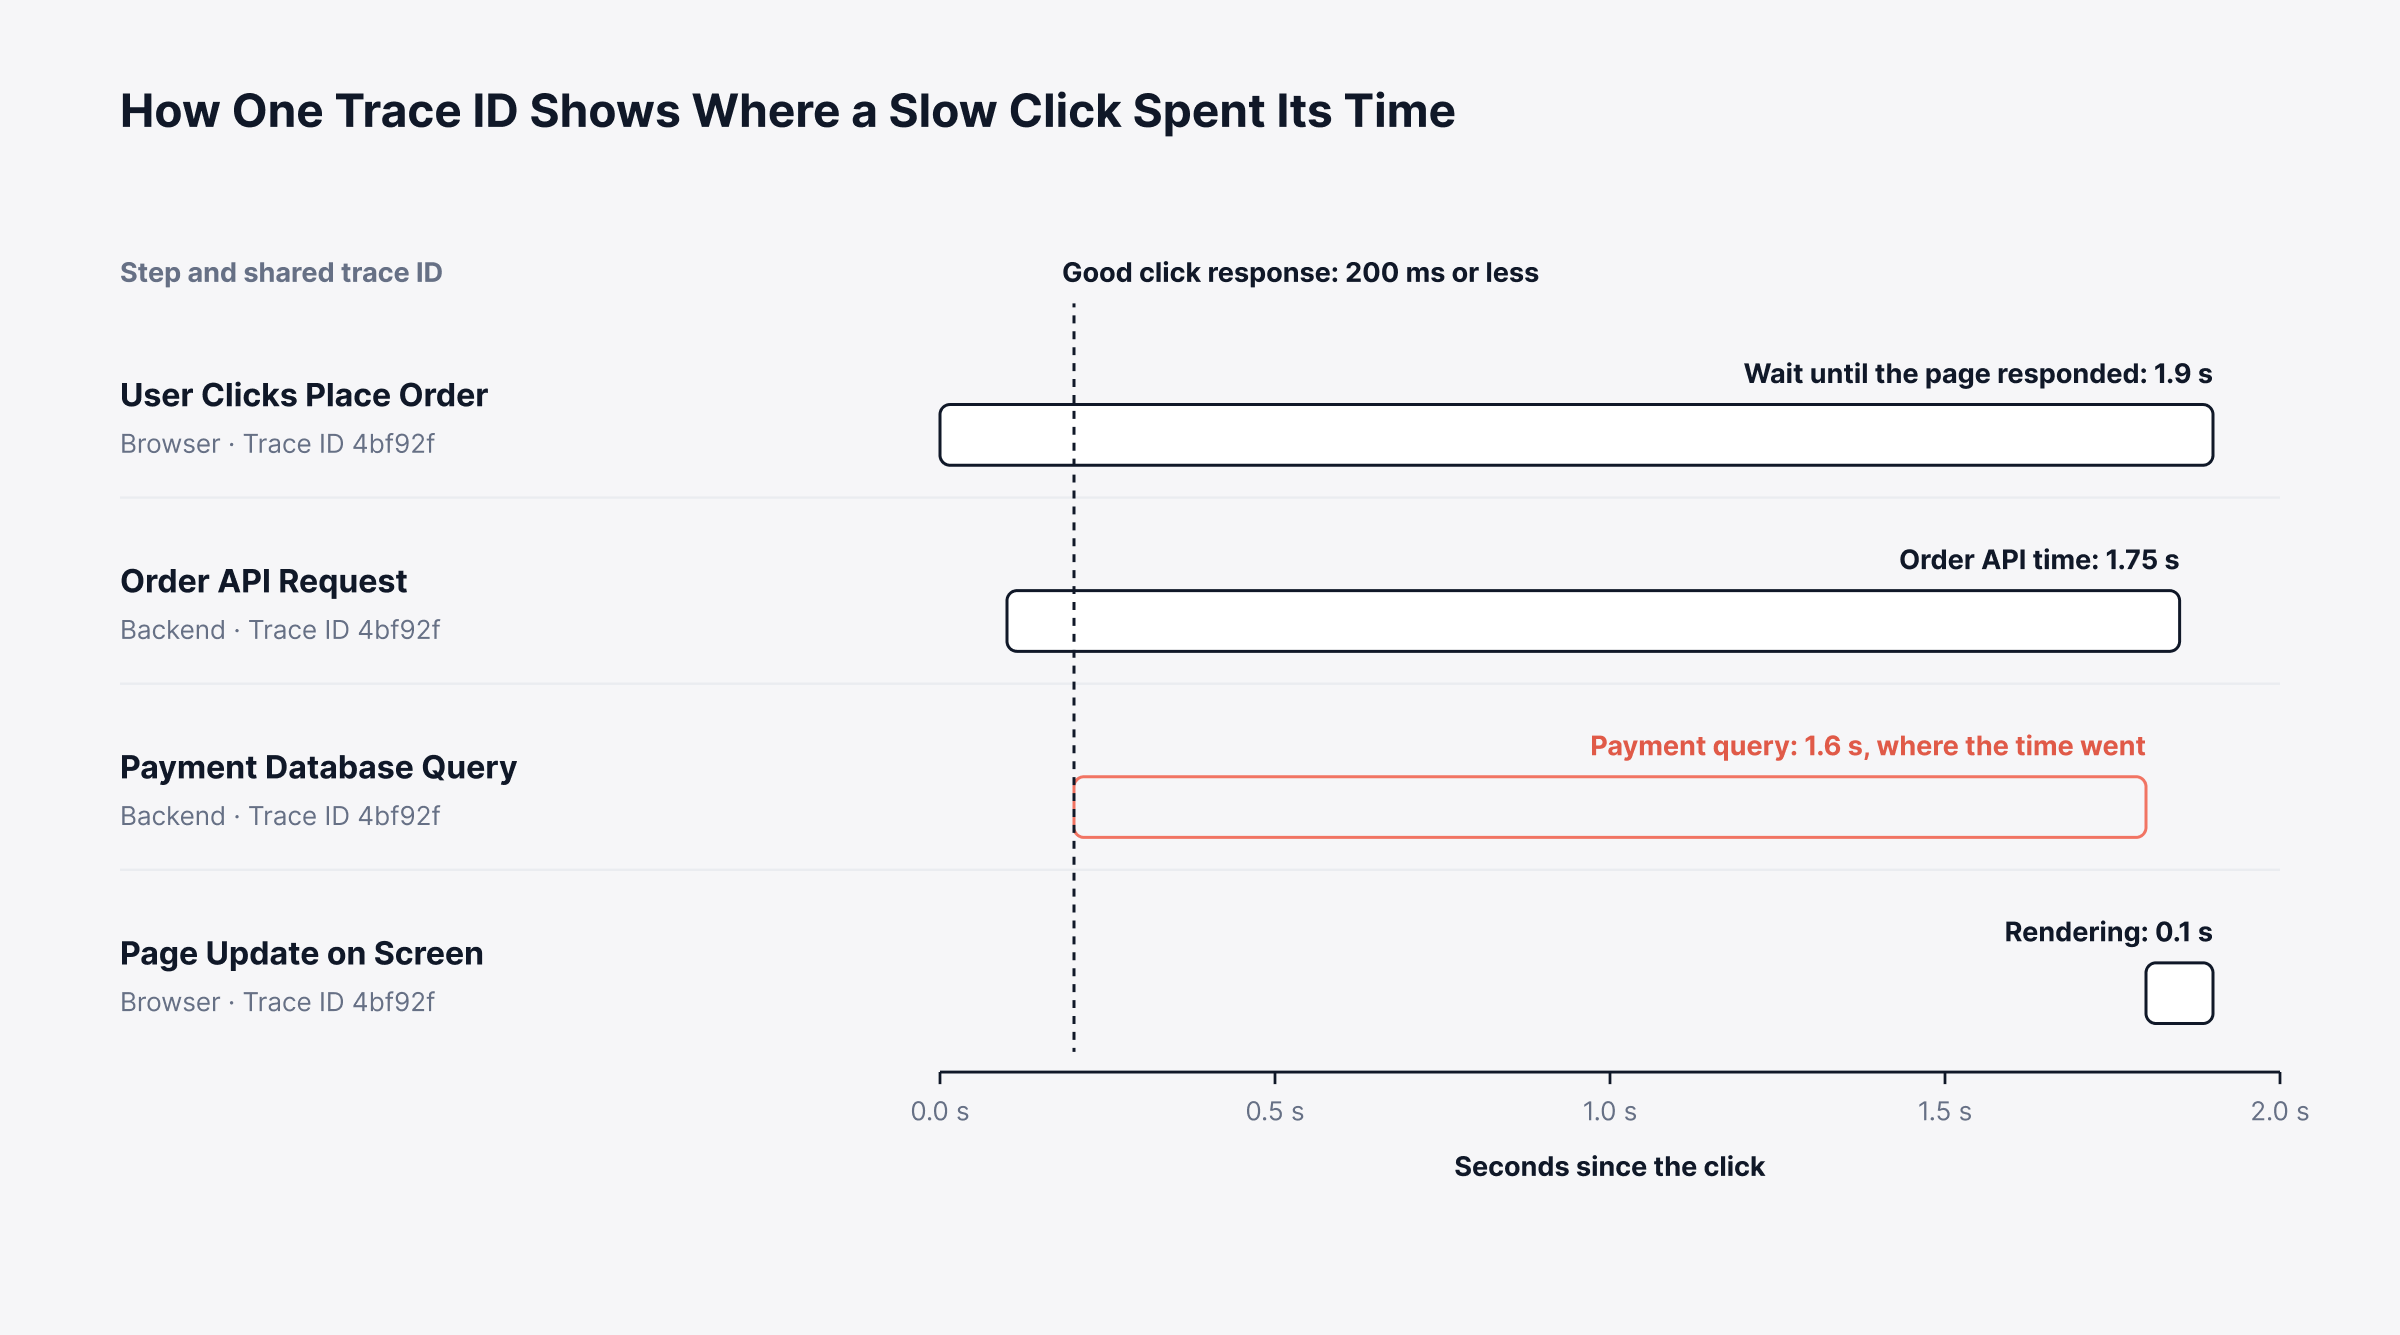
In Motadata ObserveOps, this is the job of trace correlation. It uses W3C trace context headers to match a frontend session with the APM trace for the same request. You then read the two as a single timeline, with vitals, errors and resource timing kept in RUM and the backend trace opening in APM.
Sometimes the slow part turns out to be the browser itself, and in that case frontend flame charts show which work was keeping the main thread busy. Long tasks appear against the resource waterfall, which helps separate a slow download from slow script execution.
How do You Use OpenTelemetry for Frontend Monitoring?
Using OpenTelemetry for frontend monitoring involves running its web tracing SDK in the browser and sending the spans it records to a collector, normally over OTLP. Organizations that already run OpenTelemetry on the backend tend to find this the easiest path. You get one tracing standard from the browser to the database.
A setup usually looks like this:
Web tracing SDK: Records each page load, API call, and click as a timed span
Automatic instrumentation: Ready-made packages that capture page loads, fetch and XMLHttpRequest calls, and user interactions
Header propagation: A setting that adds trace headers only to your own API domains
Collector: A service that receives spans over OTLP, then samples and filters them before storage
Why should leadership care? Because instrumentation on an open standard survives a change of tools.
One caveat. The OpenTelemetry project still calls browser instrumentation experimental, and you'll need the web-vitals library or a RUM agent for vitals and error grouping.
Who Should Own Frontend Monitoring in an Enterprise?
Frontend monitoring works best as a shared responsibility. When it belongs to nobody, alerts end up in a group channel and go unread.
A split that tends to work:
Frontend engineering: Error triage, performance fixes, source map uploads, and release tagging
SRE and platform: Agent rollout, sampling policy, data retention, and alert routing
Digital product: Funnel definitions, journey priorities, and the business case for each fix
When all three groups read the same experience dashboards, less time goes into arguing whether a problem exists. More goes into fixing it.
How do You Set Frontend Performance Targets?
Frontend performance targets work best written as a service level objective for one specific journey. One example would be keeping p75 INP at or under 200ms on checkout pages for 95% of days in any rolling month. It's easy to measure, and it has a clear owner.
An error budget attached to each objective tells you when feature work has to give way to performance fixes. Burn rate analytics then show how fast that budget is being used up, which helps you decide whether a regression has to be fixed today or can go into the next sprint.
Which Frontend Issues Should Trigger an Alert?
Only alert on frontend issues that need someone to act right now. The rest can wait for a weekly trend review with page owners.
Page someone for:
Error spikes after a release: A new error group on a revenue page within an hour of deployment
Failed synthetic journeys: Login or checkout failing from more than one location
Sustained vitals regressions: A key template crossing the "poor" band for a full hour of traffic
Alerts are only as good as the data under them. Noisy or incomplete data is where many programs struggle.
What are the Common Challenges in Frontend Monitoring?
The common challenges in frontend monitoring come down to five areas: data volume, privacy, noisy errors, third-party scripts and single-page navigation. If setup skips any one of them, confidence in the data drops quickly.
1. Data Volume and Sampling Cost
A single page view may produce dozens of events. Add replay and storage grows fast. Sampling keeps costs down, though sampling everything at one flat rate tends to throw away the rare failures you care about most.
What works well in practice? Keep every error and every vitals reading. Sample routine replays lightly, but record in full any session where an error occurs.
2. Privacy and Personal Data
Browser data can include names in URLs, typed text in replays, and identifiers in logs. Under GDPR or India's DPDP Act, that makes monitoring a compliance matter as well as a technical one.
Privacy has to be part of the first release:
Mask inputs: Hide form fields by default and reveal only fields that carry no personal data
Scrub URLs: Strip query string values such as emails or tokens before transmission
Respect consent: Load the agent only after the consent banner allows it, where law requires
Check residency: Confirm where data is stored, and prefer on-premises deployment where sovereignty rules apply
3. Noisy Errors and Unreadable "Script Error" Messages
Plenty of reported errors come from browser extensions, bots and ad blockers. Scripts from other domains cause a separate problem: loaded without the crossorigin attribute, they report a bare "Script error." with no stack trace.
Filter out the known noise and serve scripts with the right attributes, and the error queue fills with defects developers can fix. Error analytics that rank issues by session reach then tell you which one to fix first.
4. Third-Party Scripts That Slow Down Pages
Tag managers, chat widgets and ad scripts all compete with your code for the browser's main thread. Some of the worst INP and LCP regressions trace back to them. And they update on someone else's schedule.
It helps to track third-party resources as a separate category. Then their cost is visible, and you can discuss it with whoever asked for the script.
5. Route Changes in Single-Page Applications
Core Web Vitals are measured on full page loads. Single-page applications, however, switch routes without reloading anything. If the monitoring agent doesn't understand the framework's router, those route changes may never be measured.
Confirm framework support for each stack you run. This step matters more than it might seem, since React, Angular, Vue.js and Next.js, though all widely used front-end frameworks, render and route pages in different ways.
What are the Best Practices for Frontend Monitoring?
The best practices for frontend monitoring are a set of working habits, all aimed at keeping user journeys and their business value at the center:
Monitor journeys: Use journey tracking to follow checkout, sign-up, and search as complete flows, since users judge the whole journey
Read percentiles by segment: Report p75 by device, network, and region alongside any site-wide figure
Tie every error to a release: Tag events with the deployment version so regressions point straight to a change
Connect frontend and backend: Link slow sessions to backend traces so one owner holds the full story
Protect privacy by default: Mask inputs and scrub URLs before the first session is recorded
Review trends with the business: Share a short monthly view of vitals and journey completion with product and digital leaders
There's no need to adopt every habit on day one; most organizations pick them up as the rollout moves from phase to phase.
How do You Roll Out Frontend Monitoring Step by Step?
Where should a frontend monitoring rollout start? With errors and Core Web Vitals on the pages that earn revenue. Synthetic checks, backend correlation and replay follow, each one added only after the last has paid off.
Sequence the rollout so every phase answers a question the business already asks. The tiers below spell out what to switch on first and what each later phase adds on top.
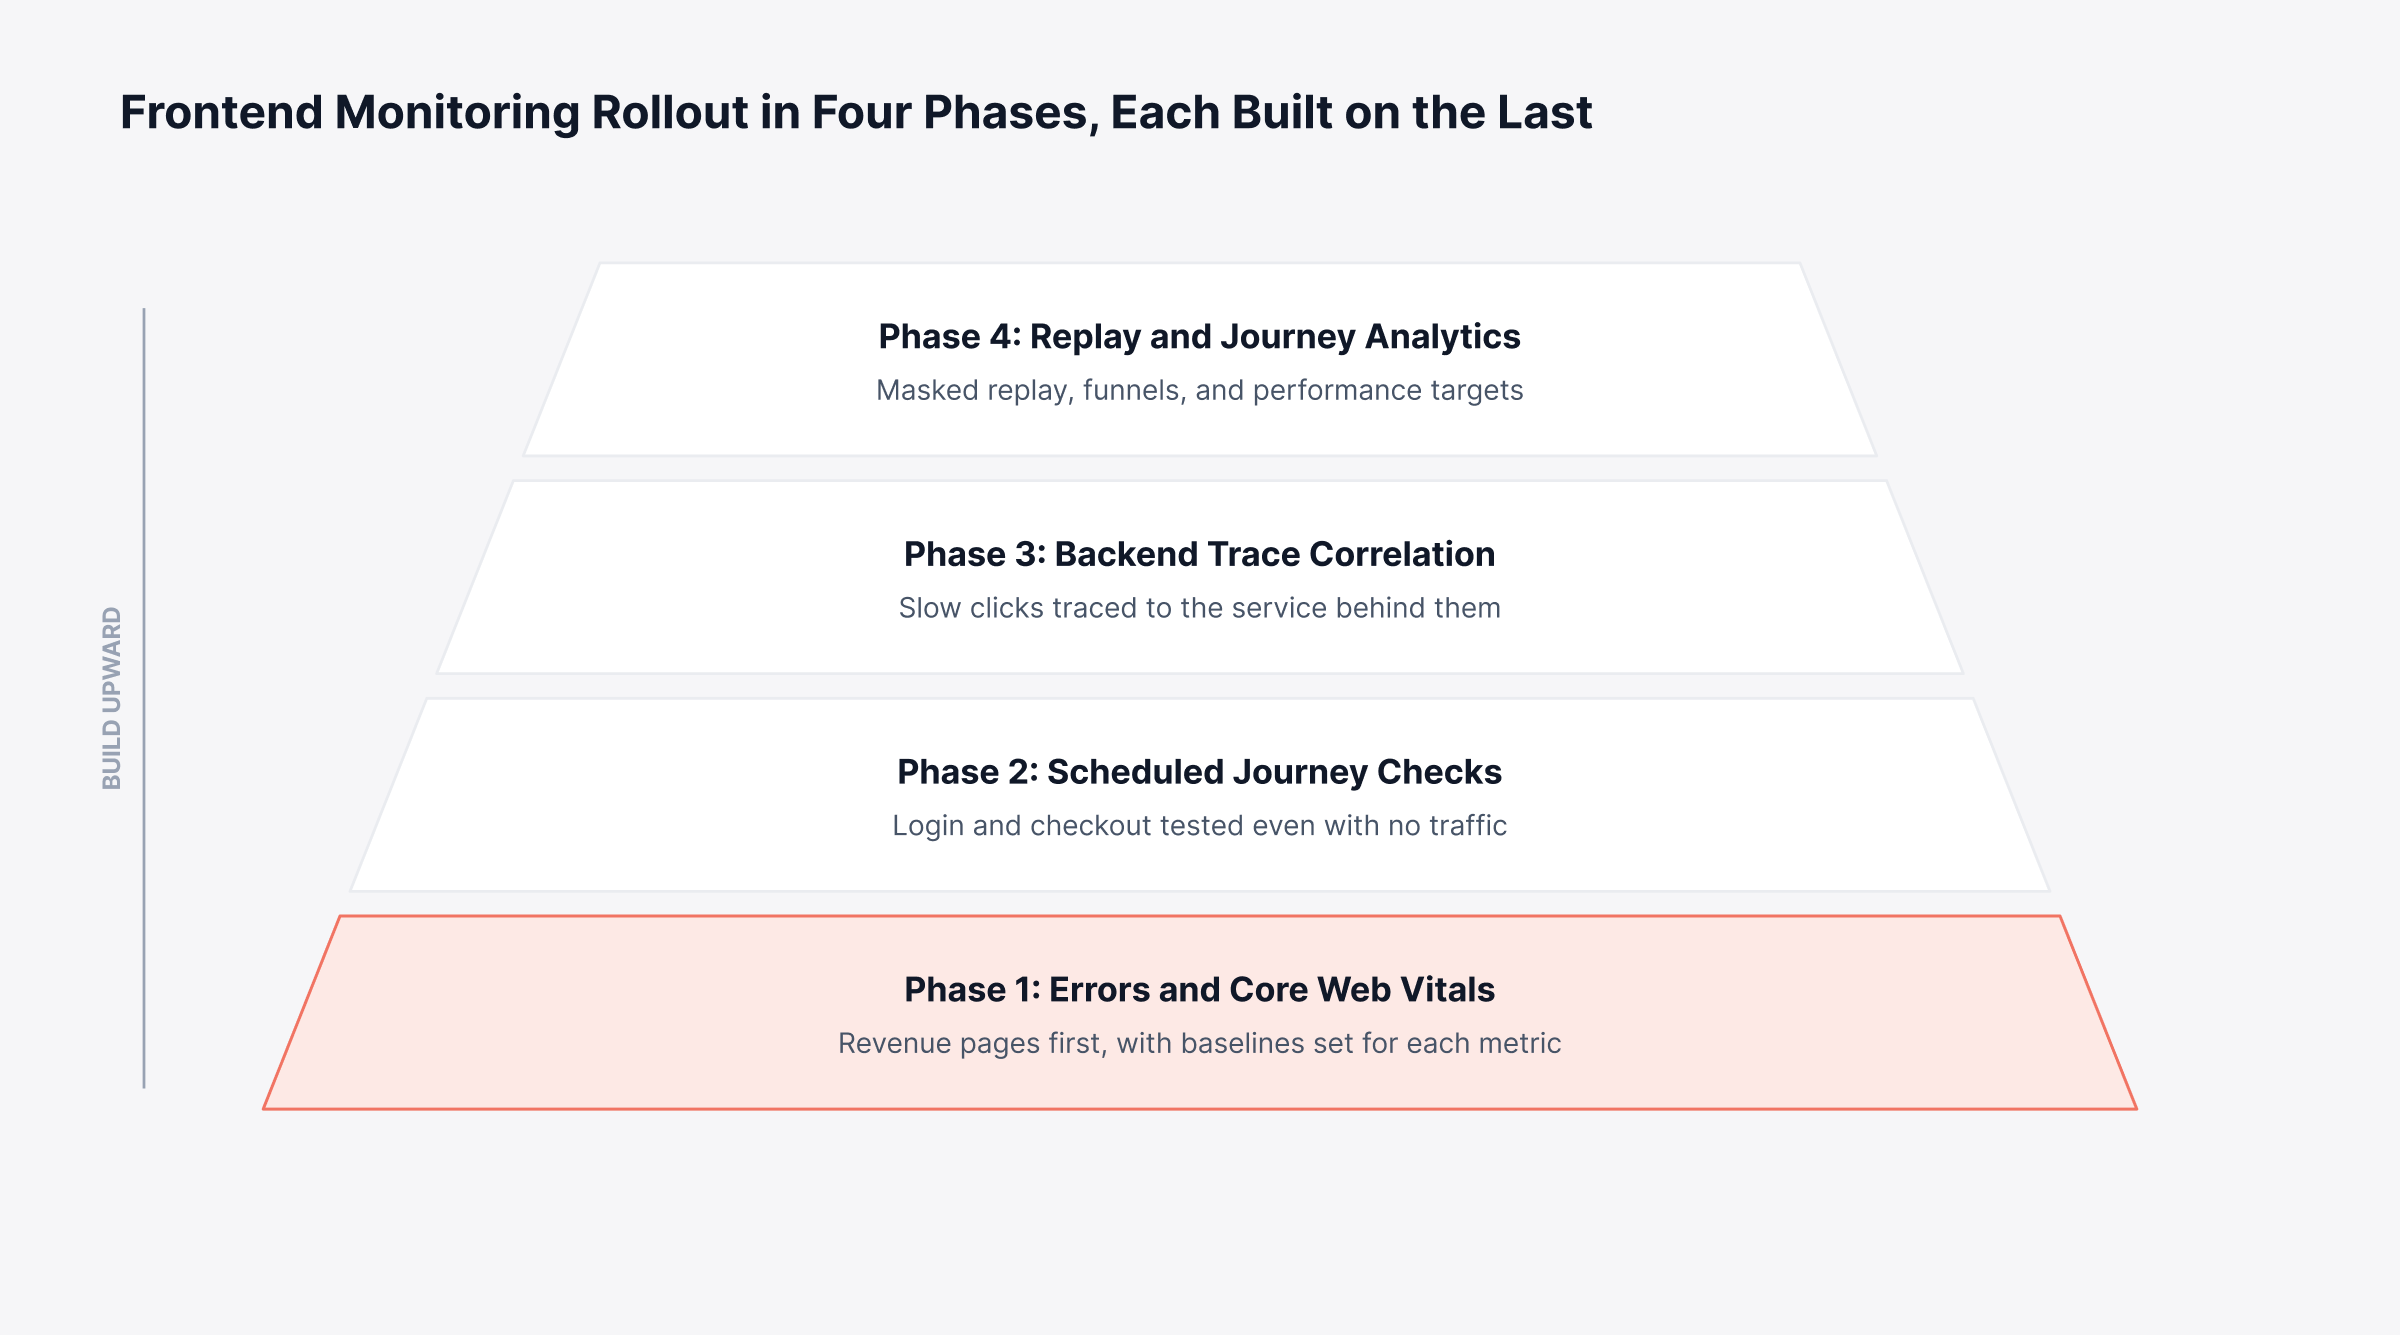
Errors and vitals: Instrument checkout, sign-up, and top landing pages first, and set baselines for LCP, INP, CLS, and error rate
Scheduled checks: Add synthetic journeys for login, search, and payment so failures surface even when traffic is low
Backend correlation: Enable trace propagation to your own APIs and confirm that slow clicks resolve to named backend spans
Replay and journeys: Introduce masked replay, funnel tracking, and frontend targets once privacy reviews are complete
Consider a hypothetical bank that follows this order and discovers, early in phase one, that one date-picker component accounts for most errors on its loan form. Fixing it gives the program an early win to point to, which makes funding the later phases a much easier conversation. By then the tool decision is simpler too, because you know how many phases one product needs to cover.
How do You Choose Frontend Monitoring Tools?
When choosing frontend monitoring tools, begin by deciding which methods should live in a single product and which you're comfortable buying on their own. The front-end tools on the market fall into the types shown in the table below, each with its own strengths and limits.
Every extra product brings its own license and agent. It also adds one more handoff in the middle of an incident, so weigh tool sprawl alongside features.
Tool category | What it covers well | Where it usually stops |
Standalone error trackers | Exceptions, stack traces, release tags | Field performance and backend context |
Web performance testers | Lab scores and page audits | Actual users on actual devices |
Session replay products | Visual playback and behavior analytics | Server-side root cause |
Synthetic monitoring services | Scheduled journey and API checks | The variety of everyday user conditions |
Unified observability platforms | RUM, errors, replay, and backend traces together | Can take longer to roll out across many applications |
Before shortlisting vendors, confirm each candidate against these checks:
Framework coverage: Does it understand routing and rendering in the frameworks you run?
Backend correlation: Can a slow session open the exact backend trace behind it?
Privacy controls: Are input masking, URL scrubbing, and consent gating configurable?
Sampling and pricing: Is billing based on sessions, events, or hosts, and how does sampling affect it?
Deployment options: Can it run on premises where data sovereignty rules apply?
Incident workflow: Do frontend alerts reach the same incident process as infrastructure alerts?
Our roundup of the best RUM tools compares vendors one by one against these criteria.
Move From Isolated Frontend Alerts to Connected Observability with Motadata ObserveOps
On its own, a frontend tool is good at showing the symptom, such as a page that loads slowly or a spike in errors. The cause, though, often lies somewhere it has no visibility into: an API, a database or a recent infrastructure change. That's where investigations stall, at the handoff between owners.
Motadata ObserveOps Real User Monitoring brings the browser side and the backend side into one workflow:
Core Web Vitals per segment: LCP, FCP, CLS, and INP tracked against thresholds by geography, device, and network
Grouped JavaScript errors: Recurring failures clustered into patterns and tied to session context
Session replay and journeys: Sessions replayed step by step, with funnel drop-off linked to the sessions that left
Trace correlation: Frontend sessions matched to APM traces through W3C trace context headers
Framework coverage: Support for Vue.js, Angular, React, and Next.js applications
It's worth being clear that no platform will do the frontend engineering on your behalf. Your developers will still need to trim heavy scripts and agree performance targets with the business. The difference a connected platform makes is in how quickly that evidence reaches the person who can act on it, so the fix goes to the actual cause sooner.
FAQs
What is the difference between frontend monitoring and real user monitoring?
Real user monitoring is one method within frontend monitoring. Frontend monitoring is the broader practice that combines field data from actual visitors with synthetic checks, error tracking, session replay, and client-side logging. In Motadata ObserveOps, RUM is the module that collects that field data.
What is frontend performance monitoring?
Frontend performance monitoring measures how quickly pages load, respond to input, and stay visually stable for actual users. It focuses on Core Web Vitals such as LCP, INP, and CLS, assessed at the 75th percentile and split by device, network, and page template.
Can OpenTelemetry handle frontend monitoring on its own?
OpenTelemetry can trace page loads, API calls, and user interactions in the browser and pass trace context to the backend. Its browser support is still marked experimental, and it does not calculate Core Web Vitals or group errors by itself, so most organizations add a dedicated RUM agent.
Does frontend monitoring slow down a website?
A well-built monitoring agent typically adds little overhead because it loads asynchronously, batches events, and sends data when the page is hidden. Sampling replays and filtering noisy events also keep data volume, and the cost that comes with it, predictable.
Which frontend issues should trigger an alert?
Alert on conditions that need action now, such as a new error group on a revenue page after a release, a failed synthetic checkout, or a key template staying in the poor Core Web Vitals band. In Motadata ObserveOps, RUM alert conditions such as JavaScript errors can be declared as incidents through unified incident declaration.
Author
Poonam Lalani
Content Strategist
Poonam Lalani is a B2B content strategist and writer with a background in computer engineering and experience across enterprise technology domains, including AI, cloud, DevOps, data engineering, and IT operations. She specializes in creating research-driven content that simplifies complex ideas and supports product education, thought leadership, and business growth.