A Practical Guide to Core Web Vitals Optimization for Better UX and Faster Conversions
When a page starts losing customers, how long does it take to find out which one? The evidence lives in your visitors' browsers, and standard infrastructure tooling measures servers instead. A speed test run from an office machine answers a different question entirely.
Pages that clear every internal check can still turn away a quarter of the people who reach them. The loss registers as weak conversion rather than as an incident anybody gets paged for, which is how it runs for months without anyone naming it.
Core Web Vitals optimization is the work of measuring page experience from your visitors' own devices and improving what those measurements show. It runs on real user monitoring, or RUM, which records what each session actually experienced instead of what a scheduled test predicted it would.
In this blog, you will see how the metrics are scored, how Motadata ObserveOps RUM finds the specific pages and audiences that are failing, what to change for each metric, how to connect a slow page to its cause in the backend, how to measure without exposing customer data, and how to confirm a fix reached the people it was meant to help.
What Is Core Web Vitals Optimization?
Core Web Vitals optimization is the practice of measuring how your pages load, respond, and hold still for actual visitors, then making changes that move those measurements into the passing ranges. The work covers three scored metrics, the diagnostic signals underneath them, and the process of proving that a change improved anything.
The three core vitals reduce page experience to numbers a monitoring platform can track continuously, session by session. ObserveOps RUM records all three as part of its Core Web Vitals coverage:
Largest Contentful Paint: How long the main piece of content takes to appear
Interaction to Next Paint: How quickly the page reacts when someone taps or clicks
Cumulative Layout Shift: How much the content jumps around while loading
Passing the assessment means all three metrics land in the good range at the same time, scored at the 75th percentile of visits. One good metric does not offset a poor one, and a page passes only when three out of four visitors had a good experience on every measure.
That second condition is what makes this a monitoring problem rather than a one-off engineering task. Improvement has to be measured in production, because the conditions that break a page are the ones a controlled test removes. It belongs in the same category as digital experience monitoring, where the point of measurement is the customer rather than the server.
Why do Lab Tests Pass While Your Visitors Struggle?
Lab tests pass because they run one page load under one favorable set of conditions, while your visitors arrive across hundreds of combinations of device, network, and location. A page tested on a wired connection with a warm cache behaves nothing like the same page opened on a mid-range Android over a congested mobile network.
What a Controlled Test Removes
A testing environment strips out the exact variables that cause pages to fail in production:
Device variation: Older phone processors throttle JavaScript execution, which pushes interaction delays well past the threshold a desktop test reports
Network conditions: Shared office Wi-Fi, patchy mobile coverage, and peak-hour congestion all delay resource delivery
Geographic distance: Every additional hop between a visitor and your origin server delays the first byte the browser receives
Cache state: A first-time visitor downloads everything, while the returning visitor a test simulates already has most of it
Third-party load: Ad scripts, chat widgets, and tag managers behave differently under production traffic than in an isolated run
Browser mix: A rendering fault in one engine disappears entirely in a test run on another
Any one of these can be the difference between a passing score and a failing one. A lab test that removes all six at once is measuring a page almost nobody visits.
Where Lab Data and Field Data Each Belong
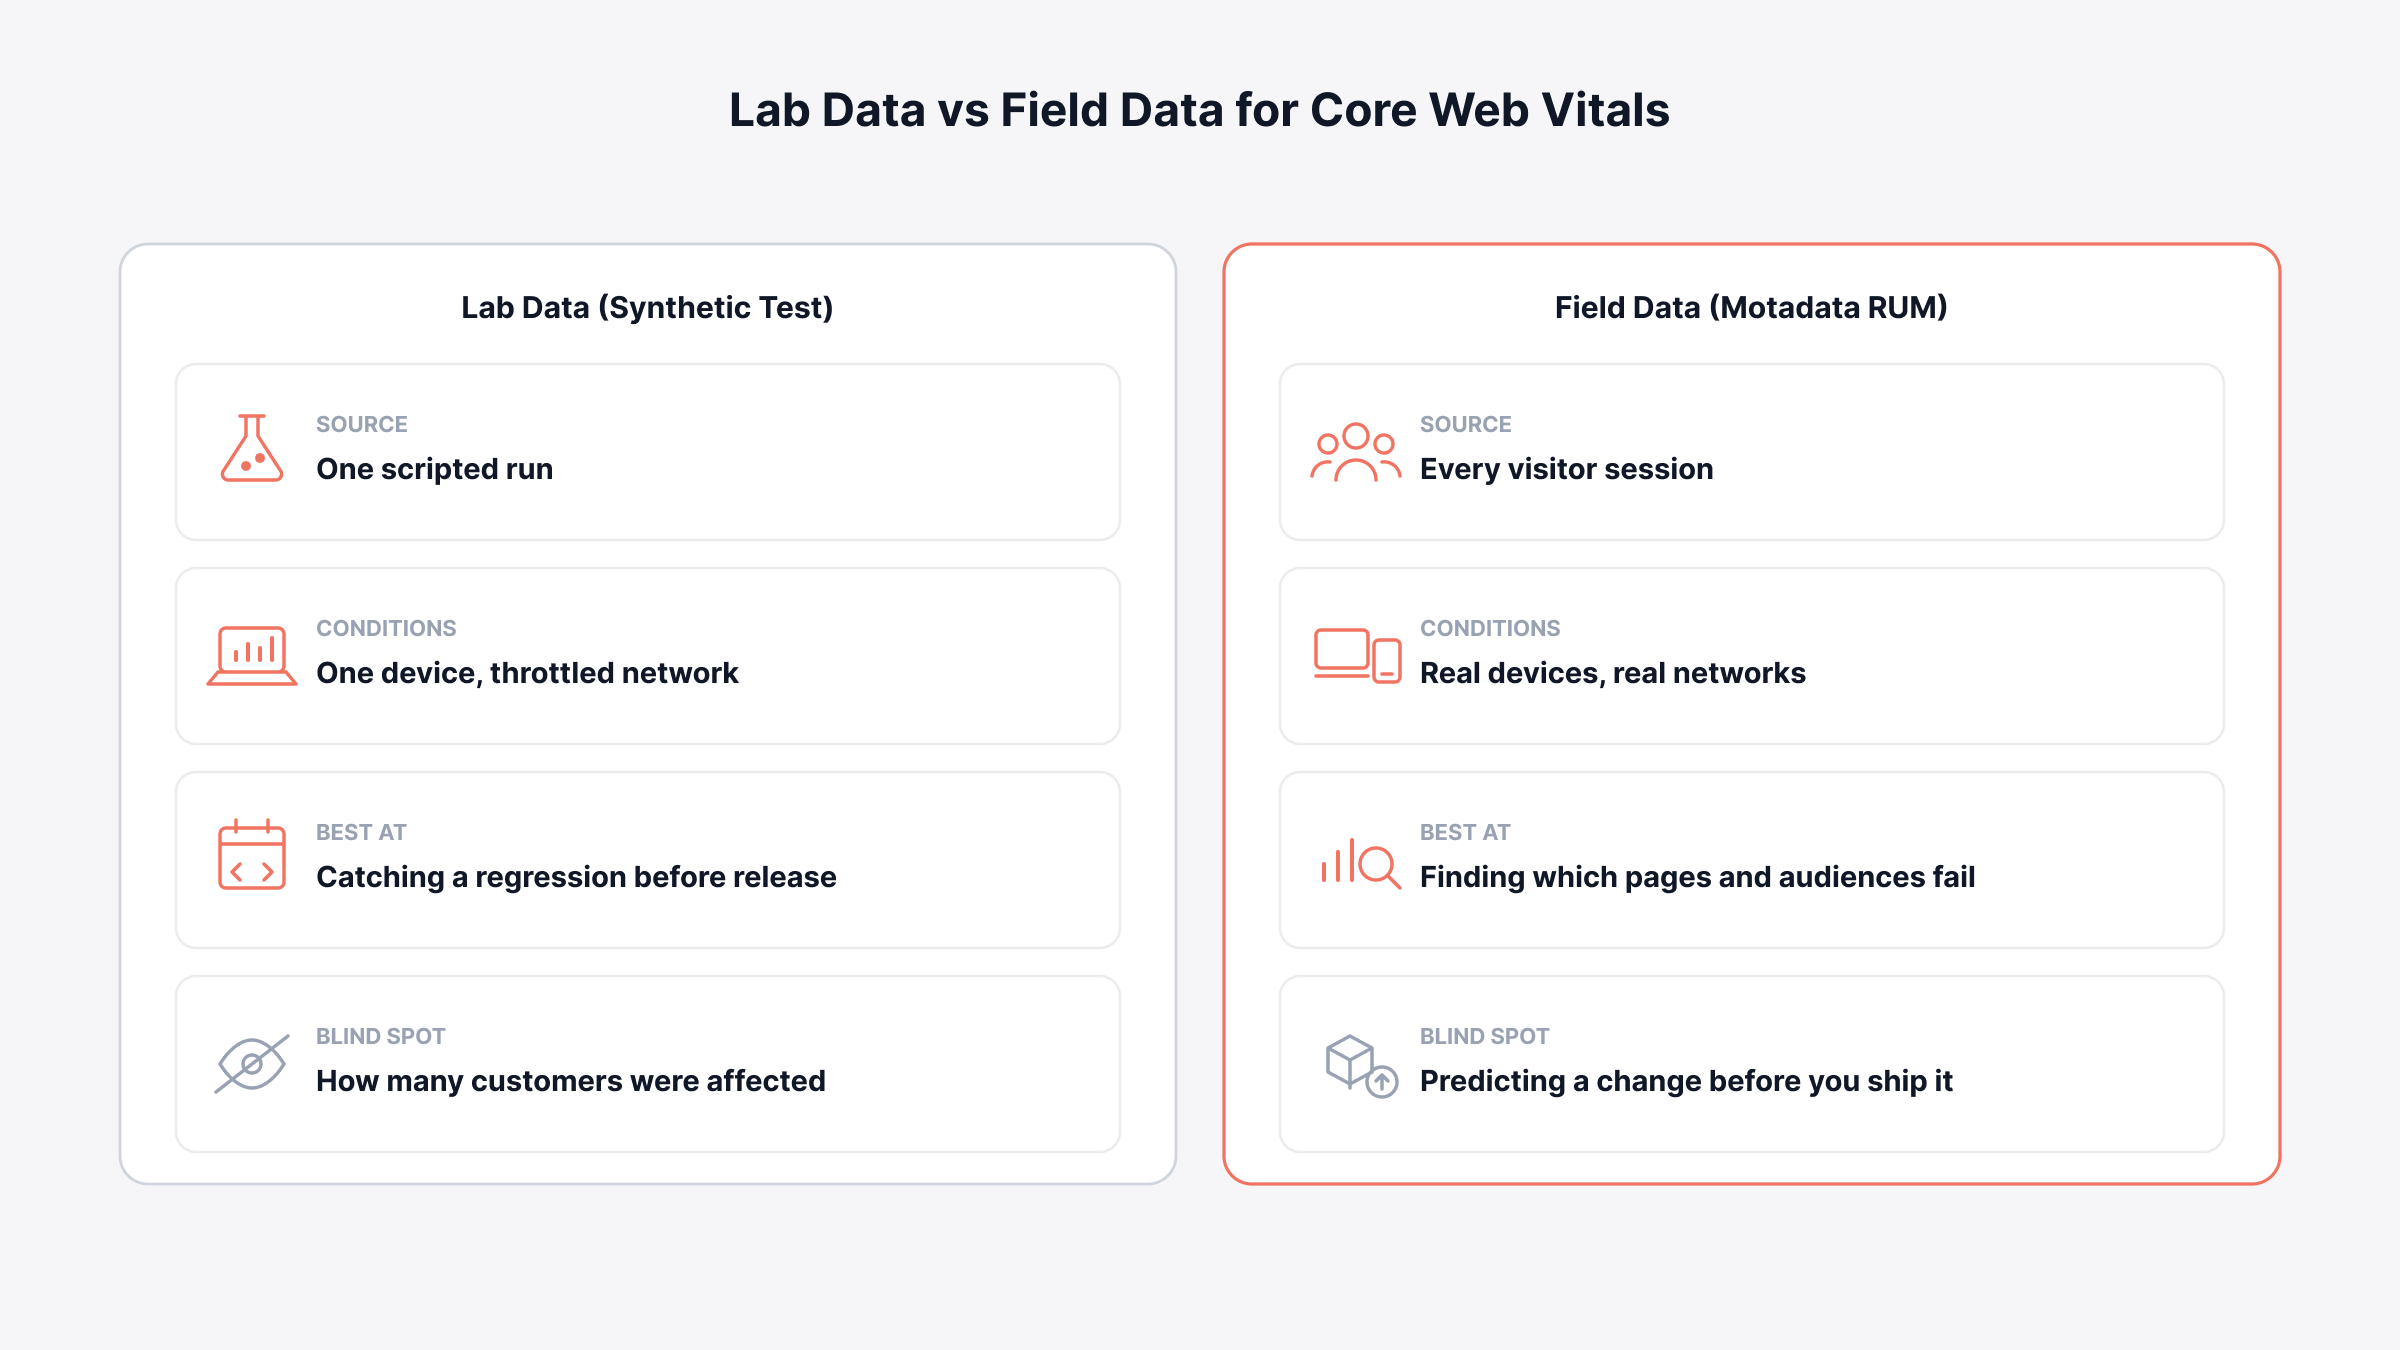
The field data vs lab data distinction carries a commercial consequence as well as a technical one. Both have a place, and the mistake is asking one of them to do the other's job.
What lab testing gives you: A repeatable score you can compare release to release
What field measurement gives you: The distribution of experiences across your actual audience, weighted by how many people had each one
This is where synthetic monitoring and real user monitoring divide the work. Synthetic checks run on a schedule and catch outages and obvious regressions before a release ships. RUM captures every session instead and how RUM works explains why that includes hardware nobody in your building owns.
Run both and treat the field numbers as the scoreboard. Each column below sets out what one method can answer and what it cannot. Each column below sets out what one method can answer and what it cannot.
Which Metrics Does Core Web Vitals Optimization Track?
Core Web Vitals optimization tracks three scored metrics, two diagnostic timings that explain them, and a satisfaction score that converts the whole picture into one number. Motadata ObserveOps RUM records every one of them per session rather than sampling from a scheduled test.
Metric | What it measures | Good | Needs work | Poor | What a bad score feels like |
Largest Contentful Paint (LCP) | Time for the biggest visible element to render | Under 2.5s | 2.5s to 4.0s | Over 4.0s | Staring at a blank or half-drawn page |
Interaction to Next Paint (INP) | Delay between a tap or click and the visible response | Under 200ms | 200ms to 500ms | Over 500ms | Tapping a button and wondering if it registered |
Cumulative Layout Shift (CLS) | How far content moves unexpectedly during load | Under 0.1 | 0.1 to 0.25 | Over 0.25 | Tapping the wrong link because the page jumped |
First Contentful Paint (FCP) | Time until anything at all appears | Under 1.8s | 1.8s to 3.0s | Over 3.0s | A white screen that lasts too long |
Time to First Byte (TTFB) | Time before the server sends its first byte | Under 800ms | 800ms to 1.8s | Over 1.8s | Everything downstream starts late |
Thresholds as published on web.dev. The Google CLS threshold of 0.1 is the one most often missed in testing, because layout shift is invisible on a fast connection where every element arrives at once.
Motadata's Web Vitals monitoring applies severity thresholds to each of these, so a page is flagged as good, needs improvement, or poor without anyone reading a raw number. Apdex adds a satisfaction view on top, using a two-second target to sort sessions into satisfied, tolerating, and frustrated.
FCP and TTFB earn their place because they narrow the search. A poor LCP with a healthy TTFB points at the browser and the assets. A poor LCP with a slow TTFB points at the server before you touch a single image.
That distinction is worth money before any code is written. It tells you whether the work belongs to a frontend developer or a backend one, which is the difference between a two-day fix and a sprint spent in the wrong place.
Instrumentation is a snippet on the page, with dedicated guides for ReactJS, NextJS, Angular, and VueJS through the platform's framework support. Collecting the numbers is the starting point. Acting on them takes more than a metric feed.
Which Monitoring Capabilities Does Core Web Vitals Optimization Need?
Core web vitals optimization needs six things from a monitoring platform, one for each stage from the first measurement through to the alert that tells you a page has regressed. Motadata ObserveOps RUM groups them as follows.
Capability | What it answers | Stage it serves |
Core Web Vitals and performance metrics | Which pages fail, and by how much | Observe |
Demographic and behavioral analytics | Which browser, device, region, or release is at fault | Segment |
Flame charts and resource-level visibility | Which resource or function consumed the time | Diagnose |
Error analytics and experience failures | Which client-side errors coincide with the slowdown | Diagnose |
Session intelligence and journey tracking | What the affected customer was trying to do | Segment |
Experience dashboards and alert policies | Did the fix hold, and will we know if it breaks again | Verify |
Two of these deserve a specific mention. Session intelligence is what turns a metric into a business case, because it shows the journey the slow page interrupted rather than the page in isolation. Alert policies are what stop the work becoming a project that gets redone next year.
For anyone approving the budget, that middle column is the one that matters. It is the difference between a request for engineering time backed by a named page and a named audience, and a request backed by a general sense that the site feels slow.
How do You Find the Pages That Are Actually Failing?
You find failing pages by ranking every URL on its 75th percentile score alongside the session volume behind it, so severity and reach appear together, which is how Motadata RUM presents the list. A page with a terrible LCP and forty visits a month is a curiosity. A checkout step with a marginal INP and two hundred thousand visits is a revenue problem.
Averages hide the failures worth fixing. A page can average a 2.1 second LCP while a third of visitors wait more than four seconds, and the average tells you everything is fine. Percentile scoring exists to surface the people the average is burying.
Once you have the page list, the next move is to segment sessions until the pattern becomes obvious. The RUM module slices Core Web Vitals data by:
Browser and version: Isolates a rendering issue affecting one engine
Device type: Separates a mobile-only problem from a site-wide one
Geography: Exposes distance to origin, regional network conditions, and missing edge coverage
Application version: Shows whether a specific release introduced the regression
A worked example makes the value clear. Suppose the product page shows an LCP of 4.2 seconds at the 75th percentile on mobile and 1.8 seconds on desktop, with the gap concentrated in a single region. That combination narrows the cause to something served differently to mobile visitors far from the origin, most often an oversized hero image with no responsive variants and no edge caching.
Without segmentation you would see one number, 3.1 seconds, and no idea where to start. Session Explorer holds the metadata behind each of those sessions, so you can open the exact visits that produced the poor score rather than reasoning from an aggregate.
How to Optimize Largest Contentful Paint
Optimize LCP by making the largest visible element arrive sooner, which usually means fixing the image or the server response that carries it. The element in question is almost always a hero image, a banner, or the first heading block.
Commercially, this is the metric that decides whether a visitor sees your page at all. A slow LCP costs you people who left before anything appeared, and they never register as a bounce from a page they judged, because they never saw it.
Work through these in order, since the earlier ones tend to return the most:
Compress and convert the LCP image: Serve WebP or AVIF at the dimensions actually displayed
Serve responsive sizes: Send a mobile visitor a mobile-width file, not the desktop original
Preload the LCP resource: Tell the browser to fetch it early rather than discovering it late
Stop lazy-loading above the fold: Deferring the hero image guarantees a poor score
Cut render-blocking CSS and JavaScript: Inline what the first screen needs, defer the rest
Improve server response time: A slow TTFB caps how good LCP can ever be
Use a CDN: A content delivery network shortens the distance to your origin server, which shows up directly in the numbers for distant markets
ObserveOps narrows this list before you start. Page load monitoring breaks each load into its component resources and surfaces the heavy ones, so the platform names the asset holding the paint back rather than leaving you to read a waterfall captured on your own machine.
How to Optimize Interaction to Next Paint
Optimize INP by reducing the JavaScript work that blocks the browser's main thread when someone interacts with the page. A tap has to wait behind whatever script is already running, and the visitor reads that delay as a page that ignored them.
This is the metric that damages transactions rather than traffic. A customer who has already reached your form and pressed submit is worth far more than an arriving visitor, and an unresponsive button is where that value gets lost.
The usual causes and their fixes:
Long tasks: Break anything over 50 milliseconds into smaller chunks and yield to the main thread between them
Heavy event handlers: Move non-urgent work out of the click handler and run it after the visual update
Unused JavaScript: Strip code paths and libraries the page never calls
Third-party scripts: Audit tag managers, chat widgets, and analytics for main-thread cost
Expensive re-renders: Update the smallest part of the DOM that needs to change
Interaction problems are frequently error problems in disguise. A handler that throws an exception on one browser produces both a spike in JavaScript errors and a spike in INP for the same segment, and ObserveOps records both against the same session, so the correlation is visible without cross-referencing two tools.
For interactions that stay stubborn, flame charts show the frontend execution timeline and name the function that consumed the frame. Long tasks and blocking scripts appear as bars you can read directly.
How to Optimize Cumulative Layout Shift
Optimize CLS by reserving space for anything that loads late, so nothing already on screen gets pushed out of the way. Layout shift is the most preventable of the three and the one most often introduced by a well-meaning change elsewhere, which is why it belongs in routine website monitoring rather than a one-time audit.
The commercial damage here is a customer tapping something they did not intend to tap. On a payment or consent screen that turns a completed action into a support ticket, and it erodes trust in a way a slow page does not.
Set width and height on every image and video: Or use a CSS aspect ratio so the box exists before the file arrives
Reserve ad and embed slots: Give third-party content a fixed container rather than letting it push content down
Preload web fonts and match fallback metrics: Font swapping reflows text and moves everything below it
Never inject content above existing content: Banners, consent notices, and promotional strips belong in pre-allocated space
Animate with transform, not layout properties: Changing top or height triggers a reflow, transform does not
Cumulative layout shift is also the metric most likely to pass in testing and fail in the field, because it depends on the order things arrive in. On a fast connection everything lands together and nothing appears to move. RUM records the shift as each visitor experienced it, which is the only view that reflects slow connections and late-loading third-party content.
Treat optimization as a standing process rather than a quarterly cleanup, because every release can undo last quarter's work. Each stage below names what it produces before handing over to the next.
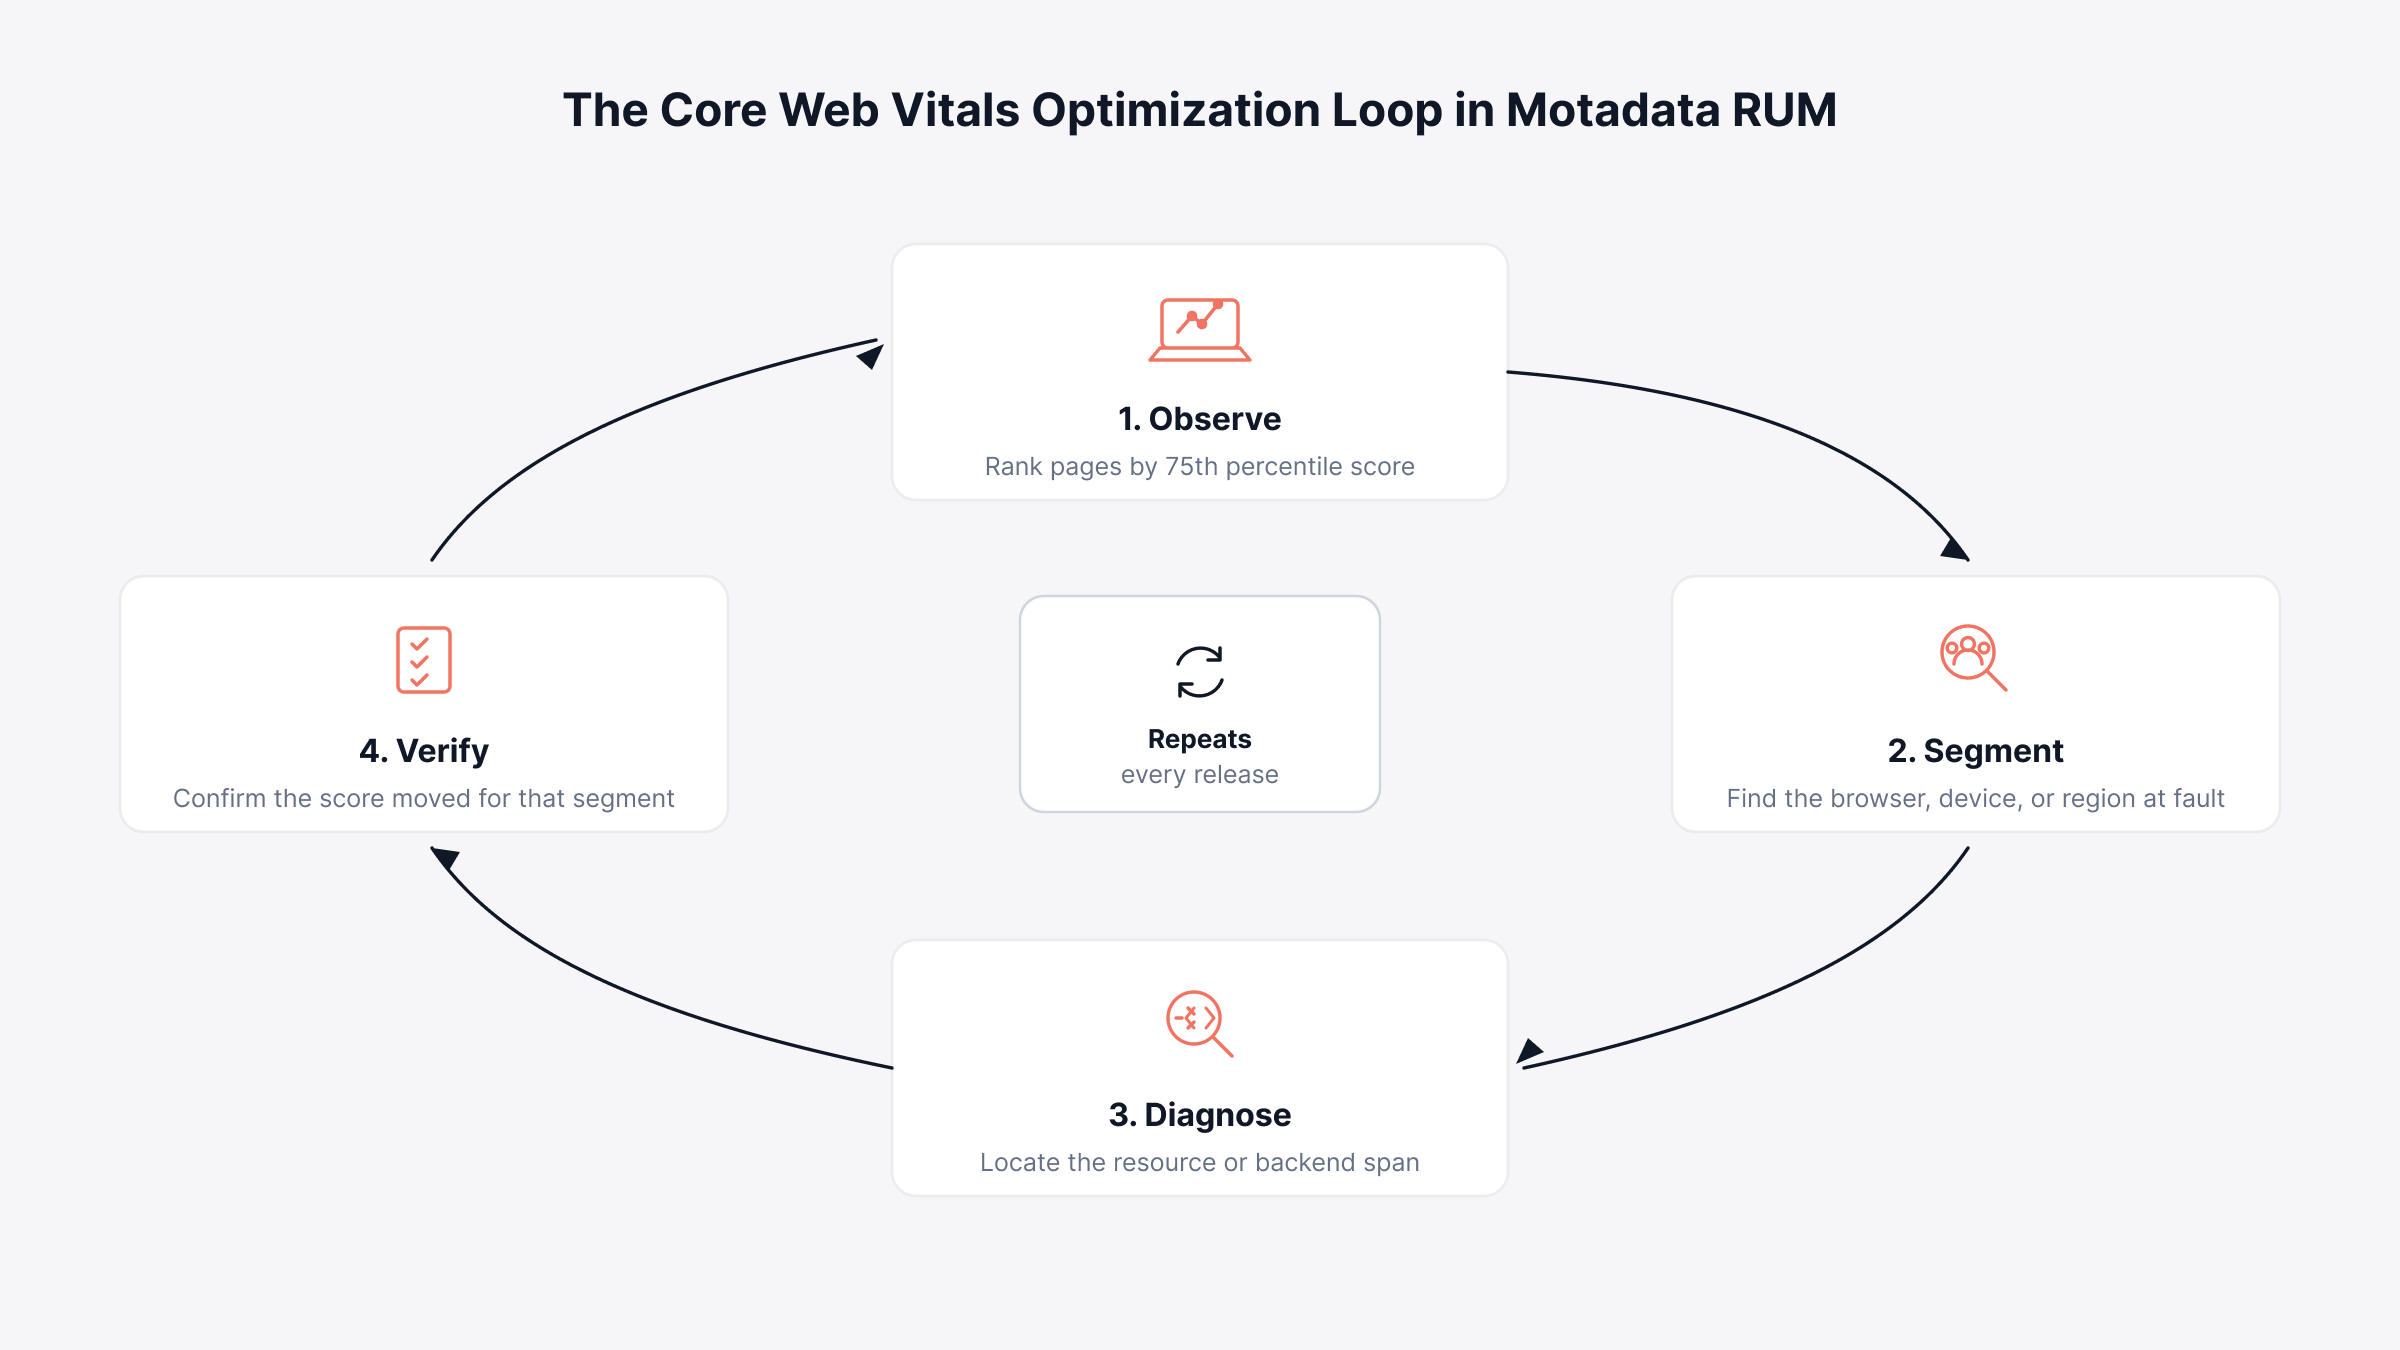
How do You Trace a Slow Page Back to Its Backend Cause?
You trace a slow page back to its backend cause by linking the browser session to the server-side request it triggered, then following that request through the services behind it, which Motadata does automatically. Frontend fixes have a ceiling, and a good share of Core Web Vitals failures originate well behind the browser.
Three signals point at the backend rather than the page:
Time to first byte is slow while asset delivery looks healthy: The server was already late before the browser had anything to render
The same page is slow across every device and browser: A frontend fault would show variation between segments
The slowdown begins at a deployment boundary: A release changed something server-side that the browser is only reporting on
A Worked Example of a Backend Delay
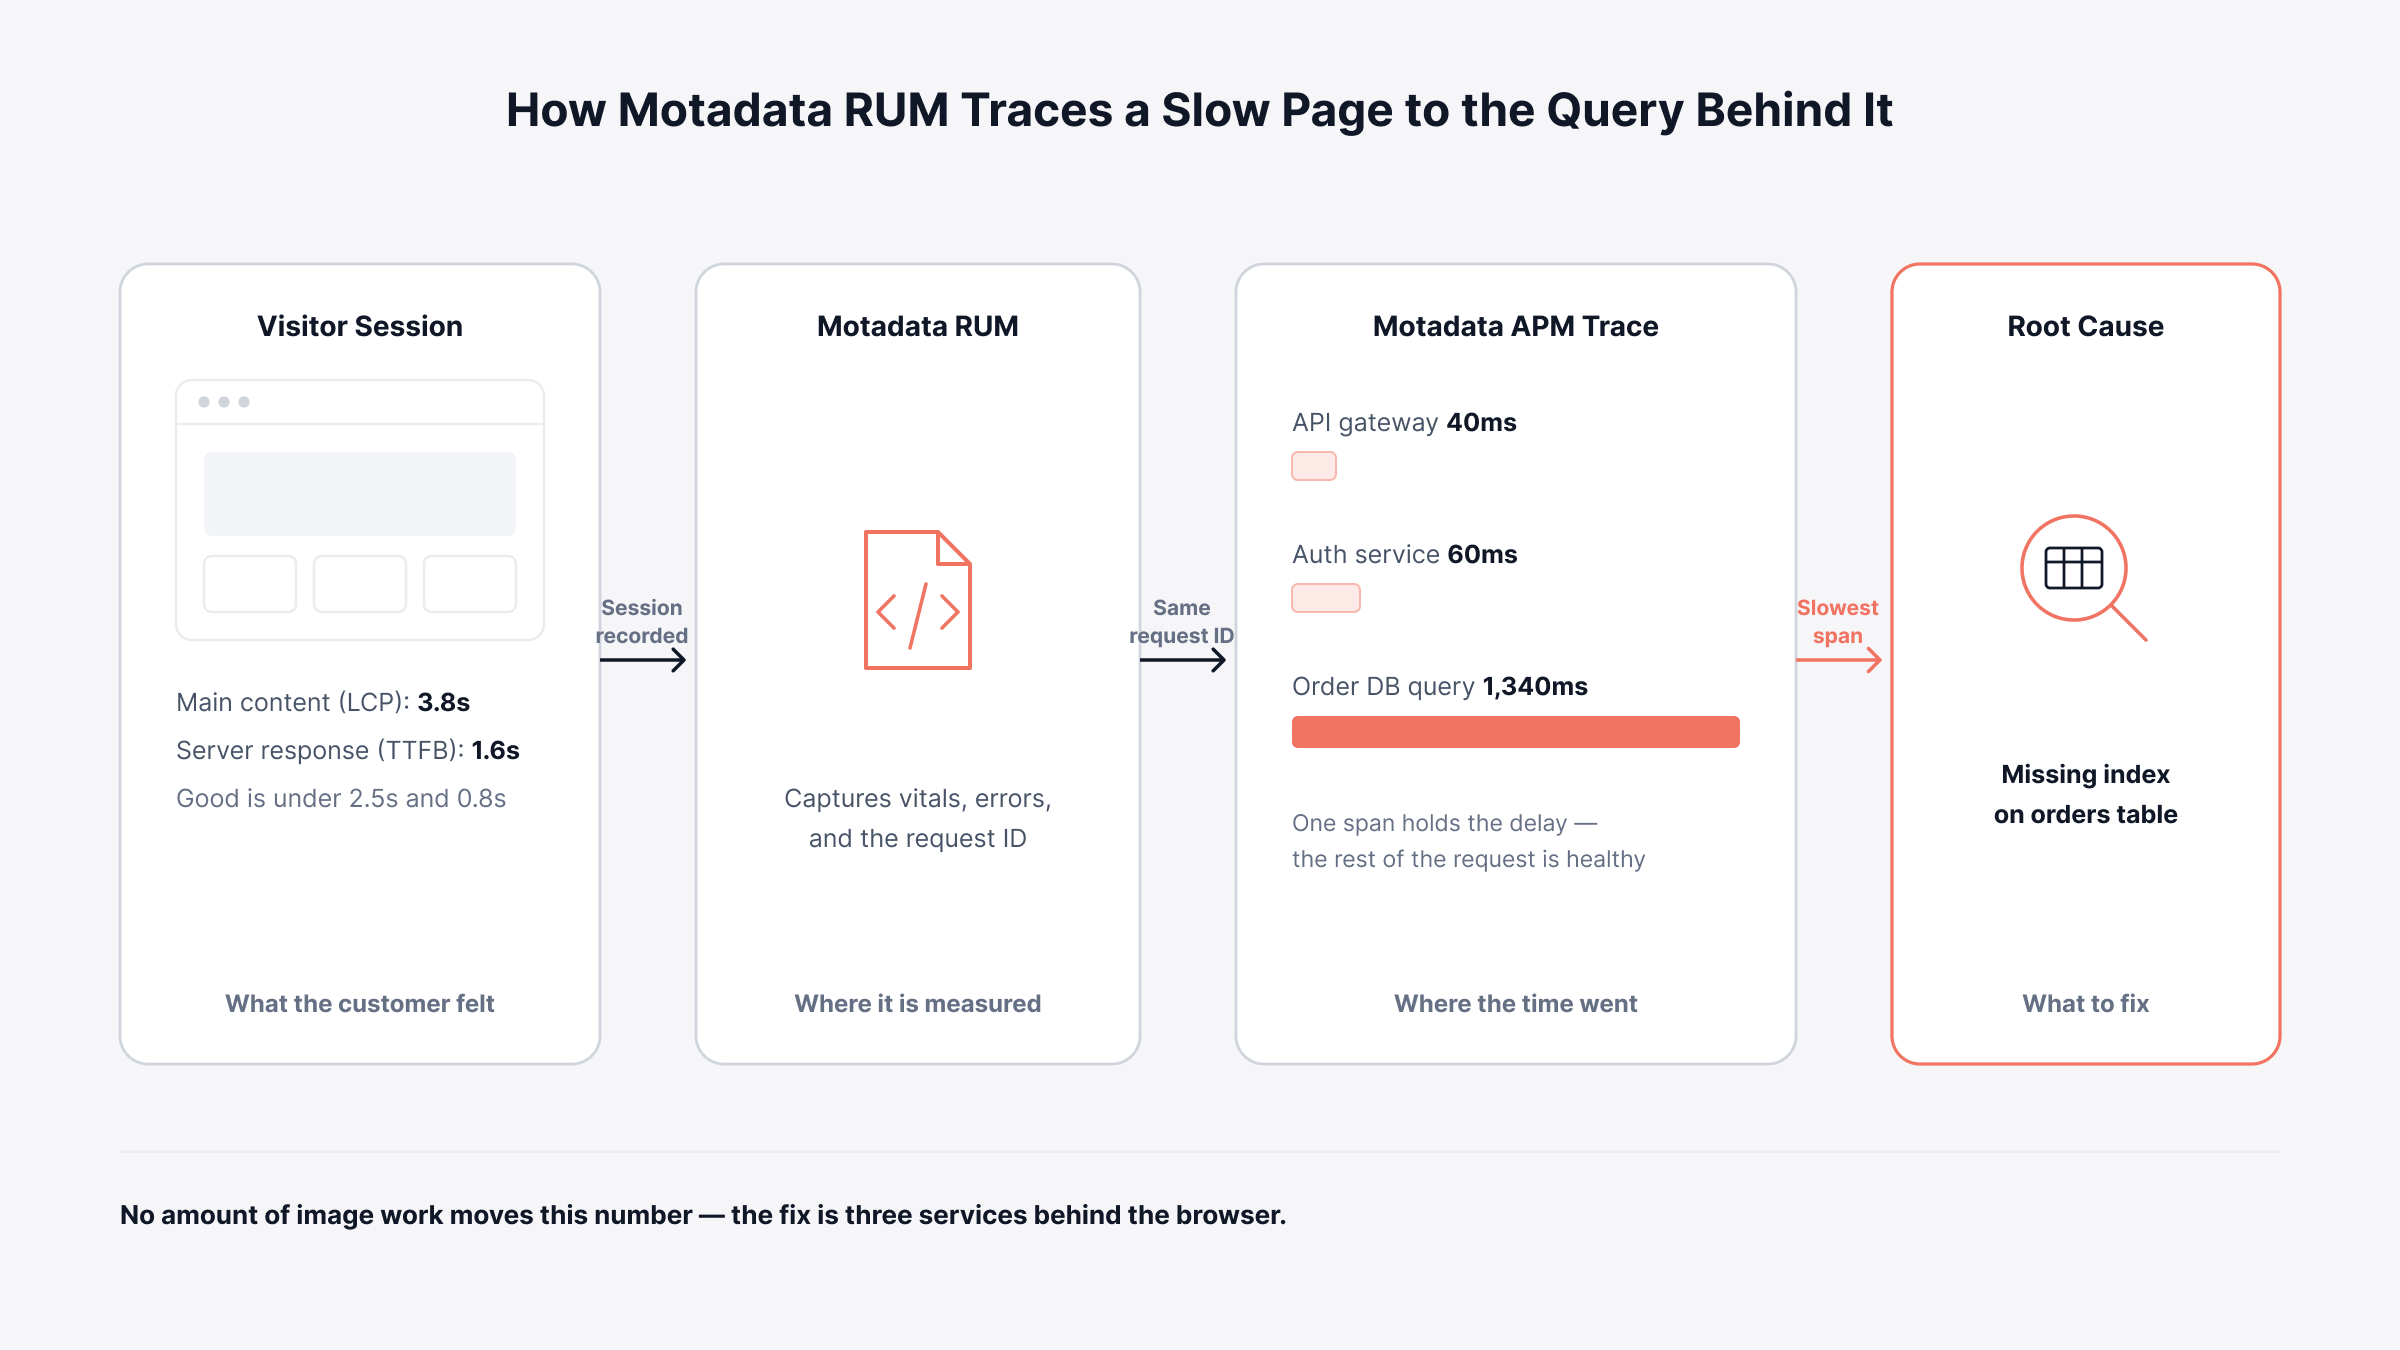
Consider a checkout page with an LCP of 3.8 seconds. The hero image is already compressed, preloaded, and served from an edge location. The delay is in TTFB, which is waiting on an API call that queries a database table whose index was dropped in a migration three weeks earlier.
No amount of image work will move that number.
What Linking Frontend and Backend Data Gives You
Trace correlation joins the RUM session to the matching trace in application performance monitoring (APM), the server-side record of the same request. That means the path from a customer complaint to a specific slow database span is a few clicks rather than a cross-team investigation.
Attached to that same request, you get:
Backend spans: Every service call in the request, each with its own duration
Service dependencies: The downstream system the slow span was waiting on
Query timings: The database call responsible, down to the statement
Logs, metrics, and network data: All in the same platform, against the same time window
This full-stack correlation is what separates core web vitals optimization inside an observability platform from the same work done with a standalone frontend tool. The metric is measured in the browser. The cause is frequently three services away, and in regulated environments like banking, the distance between those two points is measured in customer complaints.
Check TTFB before you spend a sprint on image delivery, because a slow first byte caps every metric downstream of it. The four panels below follow one slow session from the browser into the backend trace that explains it.
How do You Monitor Core Web Vitals Without Exposing Customer Data?
You monitor Core Web Vitals without exposing customer data by masking inputs at capture, sampling sessions rather than recording everything, and keeping the data inside infrastructure you control. This is the question that stops frontend monitoring projects in banking, healthcare, and government, and it rarely appears in general optimization advice. It is the same constraint that shapes monitoring for BFSI everywhere else in the environment.
ObserveOps RUM was built with those environments in mind:
Input masking: Form fields are obscured at the point of capture, so account numbers and personal details never reach the platform
Session sampling: Capture a representative share of traffic instead of every session, which controls both privacy exposure and data volume
Data control: On-premises and private cloud deployment keep customer telemetry inside your own boundary
Anonymized analytics: Demographic and behavioral views work on aggregate patterns rather than identifiable individuals
The commercial consequence is straightforward. A bank, insurer, or hospital group can run core web vitals monitoring on customer-facing journeys without a compliance review turning into a six-month blocker, which is usually the difference between measuring page experience and continuing to guess at it.
How do You Verify a Core Web Vitals Fix Worked?
You verify a fix by re-checking the 75th percentile for the same page and the same segment you originally diagnosed, over a window long enough to cover a full traffic cycle. Verification is the stage most optimization work skips, and it is the one that determines whether the next request for engineering time gets approved.
Three questions decide whether a change counts as a success:
Did the metric move for the affected segment? A site-wide average can improve while the mobile audience you were fixing sees nothing
Did anything else get worse? Preloading a hero image can starve another resource and push a different metric out of range
Did behavior change? Bounce rate, pages per session, and completion rate are the numbers a business owner will ask about
Give it enough time. A change deployed on a Friday and reviewed on Monday has seen a weekend traffic pattern and nothing else. Two full weeks is a reasonable minimum for a page with steady volume.
ObserveOps handles this stage with baselines and trend reporting rather than manual checks. Performance thresholds and trend lines run against each page continuously, and alert policies fire when a metric crosses back out of range, which is the difference between continuous monitoring and finding out from a customer. Experience dashboards hold the before-and-after view a stakeholder will ask to see.
How Does Core Web Vitals Optimization Affect Conversions and SEO?
Core Web Vitals optimization affects conversions because the delays that trip the thresholds are the same delays that make people leave, and it affects SEO because page experience is one of Google's ranking signals. Rankings are the smaller half of the case, since content relevance still carries more weight. Core web vitals seo work pays off most on pages competing against similarly relevant results, where experience becomes the tiebreaker.
On the revenue side the connection is more direct:
LCP delays raise abandonment: People leave before the page finishes drawing
Poor INP breaks trust in forms: A checkout that feels unresponsive gets abandoned mid-flow
Layout shift causes mis-taps: A customer who taps the wrong element and lands somewhere unexpected often does not come back to finish
The RUM module links vitals data to user journeys and conversion funnels, which is what turns a performance ticket into a funded project. When you can show that the checkout step with the worst INP is also the step with the highest drop-off, the conversation about engineering time changes.
What Are the Most Common Core Web Vitals Optimization Mistakes?
The most common mistake is trying to improve Core Web Vitals against the score in a testing tool rather than against the experience of the people that score represents. A handful of others show up repeatedly, and each one is visible in Motadata RUM before it becomes a wasted sprint.
Chasing averages instead of percentiles: The average passes while a quarter of visitors fail
Fixing the loudest page instead of the highest-traffic one: Impact is score multiplied by volume
Treating it as a one-time project: A single release can undo months of work
Ignoring third-party scripts: Tags added by marketing rarely appear on an engineering audit
Optimizing the frontend when the backend is the constraint: No image work fixes a 1.6 second TTFB
Never measuring after the fix: Work that cannot be shown to have helped is hard to fund twice
One more worth naming for anyone evaluating core web vitals optimization services. An agency can run the audit and hand you a list, and many do that well. What an external engagement cannot give you is the continuous measurement that tells you six months later whether the improvements survived, which is why google core web vitals optimization work tends to regress at organizations without their own monitoring in place.
Move From One-Off Speed Tests to Continuous Core Web Vitals Optimization with Motadata ObserveOps
A limitation worth stating plainly: no monitoring platform, ours included, will fix a slow page for you. Tooling narrows the search from four thousand URLs to the six that matter, and it tells you whether the change you shipped reached the people it was meant to help. Someone still has to compress the image and remove the blocking script.
What Motadata ObserveOps RUM changes is the distance between noticing a problem and knowing its cause. It captures LCP, INP, CLS, FCP, TTFB, and Apdex for every session, segments them by browser, device, geography, and application version, and surfaces the resource or function responsible through flame charts and error analytics. Input masking and sampling keep that measurement acceptable to a compliance officer.
When the cause is behind the browser, trace correlation carries you into the APM span responsible, with logs, infrastructure metrics, and network data in the same platform. Speed tests give you a number. A continuous measurement loop gives you a program, and a way to prove it worked.
FAQs
What is core web vitals optimization?
Core web vitals optimization is the process of improving how quickly your pages load, how fast they respond to input, and how stable they stay while loading. It uses measurements collected from actual visitors, then makes changes that move those scores into the passing ranges and confirms the result through continuous monitoring.
Which metrics should a core web vitals monitoring tool track?
At minimum LCP, INP, and CLS, plus FCP and TTFB to show where a delay began. Motadata ObserveOps RUM records all five per session with an Apdex satisfaction rating, and every metric can be sliced by browser, device, geography, and application version.
What is a good LCP, INP, and CLS score?
The published thresholds are LCP under 2.5 seconds, INP under 200 milliseconds, and CLS under 0.1. Each is scored at the 75th percentile of visits, so a page only passes when three out of four visitors reached that threshold rather than just the fastest ones.
Are Core Web Vitals still relevant for SEO?
Yes. They remain part of Google's page experience signals and continue to influence ranking, though content relevance carries more weight. Their clearer value is commercial, since the delays that fail the thresholds are the same delays that cause visitors to abandon pages and checkouts.
Can real user monitoring run on customer-facing pages in a regulated industry?
Yes, provided the platform masks sensitive inputs at capture and lets you control where the data goes. Motadata RUM supports input masking, session sampling, and on-premises or private cloud deployment, so telemetry from banking and healthcare journeys stays inside your own boundary.
Author
Poonam Lalani
Content Strategist
Poonam Lalani is a B2B content strategist and writer with a background in computer engineering and experience across enterprise technology domains, including AI, cloud, DevOps, data engineering, and IT operations. She specializes in creating research-driven content that simplifies complex ideas and supports product education, thought leadership, and business growth.