Best Storage Monitoring Software: 10 Tools Compared
Storage rarely fails loudly. A pool fills. Latency climbs on one LUN. The first to notice is a user whose application timed out.
The best storage monitoring software catches it earlier. It watches capacity, IOPS, latency and drive health across your arrays, which is what storage resource monitoring is for.
In this blog, you will see:
The comparison table: Ten tools ranked by depth, coverage and price.
Full reviews: Every tool carries real cons, ours included.
What changed in 2026: Drive supply made forecasting a buying problem.
By the end you will know which one fits.
What Is Storage Monitoring Software?
Storage monitoring software tracks the health, capacity and performance of your IT storage. That covers SAN arrays, NAS filers, RAID groups, virtual datastores and cloud volumes. The tool polls each device on a schedule. An alert fires when a number crosses the threshold you set.
Searching this category also turns up disk space analyzers such as WizTree and TreeSize. Those chart folder sizes on one Windows machine. The tools below watch shared arrays that a hundred workloads depend on.
Capacity monitoring answers when a pool runs out and what you need to order. We see most teams buy for the second problem, , then use the tool daily for the first. Both jobs run across the same failure domains that storage monitoring tools have to watch, from capacity and latency down to controller, disk and replication health.
How We Evaluated the Best Storage Monitoring Tools
Feature lists in this category all read the same on a vendor page. Five practical questions decided the ranking instead.
Storage depth: Does the tool reach LUNs, pools, RAID groups and fabric ports? Or does it stop at percentage full on a volume?
Multi-vendor coverage: Can one console hold Dell EMC, NetApp, HPE, Pure Storage and whatever the last acquisition dragged in?
Capacity forecasting: Does it project the date a pool fills, and how much history does it need to do that?
Correlation with the rest of the stack: When latency spikes, does the tool name the VM behind it? We get asked this more than anything else, and it splits the list into two halves.
Pricing transparency: Can a buyer size the annual bill without booking a sales call?
Two products here changed names since most buyers last shopped the category. Dell CloudIQ is now Dell AIOps. NetApp Cloud Insights is now Data Infrastructure Insights. The products are the same and only the names changed. Plenty of comparison content still uses the old ones.
The 10 Best Storage Monitoring Tools Compared
Here is a quick overview of the ten tools, using the columns that decide most shortlists.
Tool | Best For | Storage Depth | Coverage | Capacity Forecasting | Starting Price |
Motadata ObserveOps | Storage beside network, server and app data | SAN, NAS, virtual disks, HCI | Multi-vendor | AI and ML policies | One edition, quote-based |
SolarWinds Storage Resource Monitor | Dedicated SAN and NAS monitoring | LUNs, pools, arrays, file shares | Multi-vendor | Built-in trending | From $2,970 license |
ManageEngine OpManager | Mid-market IT teams wanting one tool | RAID, LUNs, tape, FC switches | 30+ vendor templates | Adaptive thresholds | From $245 (Standard) |
NetApp Data Infrastructure Insights | Hybrid and multicloud estates | Array to workload mapping | Multi-vendor | Yes | $6 per managed unit/month |
IBM Storage Insights | IBM block storage owners | Deep on IBM, fabrics in Pro | IBM-first | Pro tier only | Free, Pro from $2,072/month |
Dell AIOps | Dell PowerStore and PowerMax fleets | Deep on Dell hardware | Dell only | Yes | Free with ProSupport |
Paessler PRTG | Small and midsize teams on SNMP | Sensor-based, per metric | Multi-vendor | Basic trending | $200/month for 500 sensors |
Datadog | Cloud-native and container teams | Host and volume level | Cloud-first | Via forecast monitors | $15 per host/month |
LogicMonitor | SaaS monitoring with automated discovery | Array and volume level | Multi-vendor | Yes | $16 per hybrid unit/month |
Zabbix | Teams with engineering time and no budget | Whatever you template | SNMP and API | Trigger-based | Free, support from $325/month |
The coverage column filters the top storage monitoring tools the most. A vendor-specific tool reads its own arrays more deeply than anything else will. It also goes blind the moment a second brand arrives in the rack.
Detailed Overview of the 10 Best Storage Monitoring Software in 2026
Here is a closer look at the top storage monitoring tools.
1. Motadata ObserveOps
Best for: Teams that want storage metrics next to their network and server data.
Rating: 4.6/5 on G2, 4.3/5 on Gartner Peer Insights.
Pricing: ObserveOps Infinity is one edition, metered by what you monitor rather than by how much data it emits. Log and flow monitoring are licensed per source. Quotes are scoped to your deployment, and a free trial is available.
Storage almost never breaks on its own. A slow datastore usually traces back to a noisy neighbor VM, a saturated fabric port or a backup job that overran its window.
Answering that in one console is the point. It is why our disk space monitor ships inside a wider platform instead of as a standalone tool.
ObserveOps collects storage as one of nine supported infrastructure types. Servers, network, cloud, virtualization and hyperconverged devices are the others.
MotaAgent polls Linux and Windows hosts as fast as every second, and latency is reported down to sub-millisecond values such as 0.25 ms.
That precision matters more than it sounds, because your team will end up arguing about whether a 2 ms jump is real.
Our own correlation engine sits underneath all of it. It handles anomaly detection, forecasting and alert correlation across every ingested signal.
A capacity trend and a latency anomaly on the same array arrive together. You get one story instead of two tickets. Central Bank of India and Nuvoco Vistas Corp Ltd both run the platform in production.
The Infinity release in August 2026 changed the commercial shape of all this. Four editions collapsed into one, so no storage capability sits behind an upgrade wall.
We also cut the platform's own hardware footprint by up to 30 to 40 percent on an equivalent deployment.
That counts for more than usual in a year when servers and drives got expensive. The figure is indicative, and it moves with device mix, retention and polling interval.
Star ratings only tell you so much. It helps to hear from a team that runs ObserveOps every day. Check out this review on G2 from one of our customers. 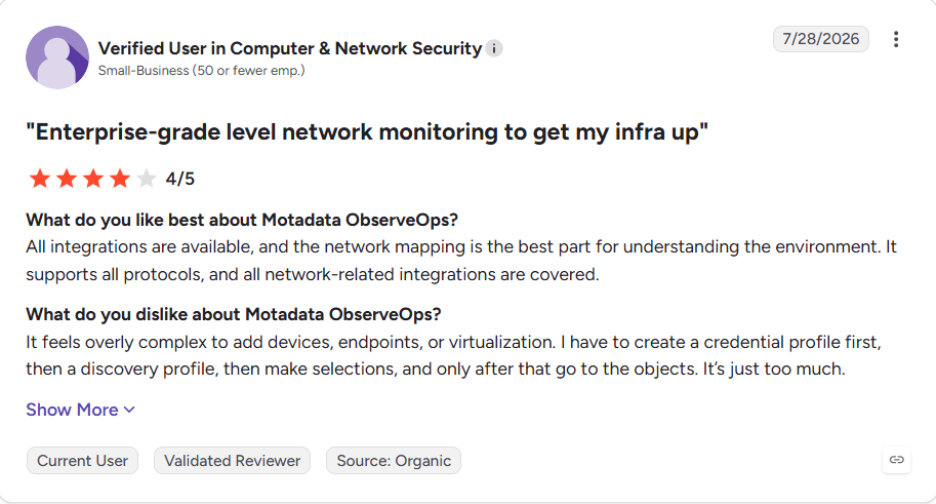
Read more ObserveOps reviews on G2.
Pros
- Storage, network, servers, logs and traces share one platform and one data store, so root cause work stops at one console.
- Six deployment modes run from single-box to high availability over WAN, and regulated buyers usually need that range on paper.
- The adaptive AI needs no weeks of baseline training before it produces anything useful.
- Log and flow licensing counts sources rather than gigabytes, so a chatty array does not move the bill.
Cons
- We publish the licensing model but not the prices, so you still cannot size the cost from a web page.
- Your hardware vendor's own tool still reads that hardware more deeply than we do.
- Our review footprint is smaller than the largest incumbents carry, and Infinity only reached general availability in August 2026.
- A team watching two NAS boxes will not use most of the platform.
2. SolarWinds Storage Resource Monitor
Best for: Storage teams that want one dedicated tool across arrays from several vendors.
Rating: 4.3/5 on G2, 4.4/5 on Gartner Peer Insights.
Pricing: Storage Resource Monitor starts at $2,970 as a perpetual license. Subscription pricing starts at $8 per node per month.
SRM is the closest thing here to a purpose-built answer. It maps arrays, pools, LUNs, volumes and file shares, then draws the path from a VMware datastore down to the spindles. Vendors covered include Dell EMC, NetApp, HPE, Pure and Hitachi.
Agentless collection is genuinely painless. Capacity trending has been in the product long enough to trust.
What you are really buying is the Orion platform, which is a heavier commitment than the module price suggests. Teams working through SolarWinds pricing usually find the storage module is the smaller half of the bill.
Pros
- Storage depth is the best on this list outside the hardware vendors' own tools.
- Agentless discovery gets a mixed estate onboarded quickly.
- Reporting is mature and easy to hand to a capacity planning meeting.
Cons
- SRM runs on the Orion platform, so the real cost includes infrastructure and admin time nobody planned for.
- Turn/River Capital took SolarWinds private in 2025. Renewal increases have been widely reported since.
- The interface carries a lot of history. It takes longer to learn than newer SaaS tools.
3. ManageEngine OpManager
Best for: Mid-market IT teams that want storage, network and servers on one bill.
Rating: 4.4/5 on G2, 4.4/5 on Gartner Peer Insights.
Pricing: Standard Edition starts at $245 and Professional at $345. Enterprise pricing starts around $11,545 for 250 devices. Perpetual and subscription options both exist.
OpManager gives you more storage detail than a general infrastructure monitor usually does.
It ships templates for more than 30 storage vendors. Coverage runs to RAID controllers, drives, LUNs and storage pools. Tape libraries and Fibre Channel switch ports are in there too.
Adaptive thresholds come included. So does forecasting to the 80 and 90 percent marks. We have watched small teams cover a whole rack with it inside a week.
Cloud storage is the gap, because AWS and Azure volumes need the Applications Manager plugin.
Pros
- RAID and array monitoring: Controllers, drives, fabric ports, LUNs and pools in one view. Tape library management: Drive status, cartridge issues and media location over SNMP. FC switch monitoring: Fabric switch ports, connections and error counters. Capacity forecasting: Predicts when storage reaches 80, 90 or 100 percent full. Automated first response: A capacity alert can clear logs or move folders on its own.
- Storage sits beside network and server monitoring in the same console.
- Vendor templates cover most hardware you are likely to have inherited.
Cons
- Storage depth stops short of a dedicated SAN tool once fabric-level analysis is needed.
- The edition and add-on structure gets confusing, and the jump to Enterprise is steep.
- Cloud storage needs a separate plugin. The unified view costs extra licensing to reach.
4. NetApp Data Infrastructure Insights
Best for: Hybrid and multicloud estates that need storage tied to the workloads using it.
Rating: 4.3/5 on G2, 4.4/5 on Gartner Peer Insights.
Pricing: Standard runs $6 per managed unit per month and Premium $9. Volume pricing starts above 1,000 managed units.
Formerly Cloud Insights, this answers a question array vendors usually dodge. Which application caused the latency?
It maps the chain from an application down to the volume serving it. NetApp and third-party hardware are both covered.
The workload security module adds ransomware detection on file shares. For anyone running large NAS estates, that alone can justify the line item.
Sizing the bill is the hard part, because a managed unit is not one array. The count only settles after discovery runs.
Pros
- Nothing else here connects storage to application behavior as cleanly.
- SaaS delivery means no monitoring server for your team to patch.
- NetApp storage monitoring goes deeper here than any generalist tool manages.
Cons
- Managed unit pricing is hard to forecast until discovery has run.
- The product is more than a small on-premises estate needs, and it prices that way.
- Coverage of non-NetApp arrays is good rather than equal.
5. IBM Storage Insights
Best for: IBM block storage owners who want monitoring without a new line item.
Rating: 4.4/5 on Gartner Peer Insights. Too few verified G2 reviews to publish a score.
Pricing: The base tier is free for owners of IBM block storage. Storage Insights Pro starts at $2,072 per 50 TB of capacity per month.
Free tiers rarely earn much attention, and we make an exception for this one. It gives health, status and basic performance across your IBM systems. It also opens a support path into the array, so nobody has to upload logs by hand.
Pro is where the planning features arrive: capacity forecasting, reclamation candidates, tiering advice, two years of history, and visibility into switches and fabrics.
The split is clean and the value is obvious if you are IBM-heavy. Outside that estate, this is not the tool.
Pros
- The free tier costs nothing and removes a real support friction point.
- Depth on IBM hardware is as good as it gets.
- Capacity-based Pro pricing scales with the estate rather than the device count.
Cons
- Non-IBM arrays are effectively out of scope. A mixed estate needs a second tool.
- Pro pricing per 50 TB climbs fast in a large environment.
- The useful capacity planning features all sit behind the paid tier.
6. Dell AIOps
Best for: Fleets built on Dell PowerStore, PowerMax, PowerFlex and Unity.
Rating: 4.5/5 on Gartner Peer Insights.
Pricing: Free for assets covered by a ProSupport or higher contract.
Dell AIOps started life as CloudIQ. It became APEX AIOps Infrastructure Observability, and now carries a third name. The product underneath has been consistently good throughout, which the branding does not convey.
It scores every system on health, capacity and performance. It predicts capacity exhaustion and flags anomalies against learned baselines. It also names the noisy neighbor workload inside an array.
In a Dell shop already paying for ProSupport, we would not walk past it. The limit is obvious enough: it will not look at another vendor's hardware.
Pros
- No extra cost for anyone already holding a ProSupport contract.
- Analytics quality is well above what free normally buys.
- Coverage extends past storage into Dell servers, switches and backup appliances.
Cons
- It reads Dell hardware only, which rules it out as your single console in a mixed estate.
- Three names in three years makes documentation and internal knowledge go stale fast.
- Cloud-hosted only, which some regulated environments will not accept.
7. Paessler PRTG
Best for: Small and midsize teams monitoring storage over SNMP alongside everything else.
Rating: 4.6/5 on G2, 4.5/5 on Gartner Peer Insights.
Pricing: PRTG 500 runs $200 per month billed annually and PRTG 1000 is $358. A free tier covers 100 sensors permanently.
PRTG counts sensors rather than devices. One sensor is one metric on one device. That model is refreshingly honest until you point it at a storage array. We have watched a single NAS eat forty sensors across volumes, disks and interfaces.
What you get for the money is breadth and speed. Sensors exist for NetApp, Synology, QNAP, Dell EMC and generic SNMP devices.
The auto-discovery genuinely works, and a small team can cover the estate in an afternoon. Depth stops at the metric. PRTG will tell you a LUN is slow and leave the diagnosis to you.
Pros
- Deployment is quick and the learning curve is short.
- One tool covers network, servers, storage and applications for a small team.
- The permanent free tier makes evaluation risk-free.
Cons
- Paessler raised license prices sharply in 2024. Long-standing customers have been vocal about renewal costs.
- Sensor counting punishes storage monitoring in particular, because arrays are metric-dense.
- There is no array-level analysis, so a performance problem still needs a second tool.
8. Datadog
Best for: Cloud-native and container teams that already run Datadog for everything else.
Rating: 4.4/5 on G2, 4.4/5 on Gartner Peer Insights.
Pricing: Infrastructure Pro is $15 per host per month billed annually. On demand it is $18, and Enterprise is $23.
Datadog treats storage as one more dimension of infrastructure. Disk usage, filesystem metrics and I/O wait land beside container and Kubernetes data.
Forecast monitors then project a disk toward full using that disk's own history.
That model fits cloud-native estates well and physical SAN estates poorly. Cloud block and object storage have native integrations. The array-level view a storage administrator expects is missing.
Host-based billing also punishes container-dense environments, which is the pattern behind most Datadog pricing complaints we hear.
Pros
- Correlation across the stack is the strongest here for cloud-hosted workloads.
- The integration catalog covers almost anything you are running.
- Forecast monitors handle capacity alerting with no separate planning tool.
Cons
- Array-level SAN and NAS monitoring is out of scope. A physical estate stays uncovered.
- Per-host billing sits alongside separate meters for logs and traces. The annual number is hard to hold steady.
- Storage administrators will find that the vocabulary and the views were built for someone else.
9. LogicMonitor
Best for: Teams that want SaaS monitoring with discovery handled for them.
Rating: 4.5/5 on G2, 4.5/5 on Gartner Peer Insights.
Pricing: LM Envision lists at $16 per hybrid unit per month for Essentials. Advanced is $27 and Signature is $53.
LogicMonitor's pitch is that nobody should be hand-writing monitoring templates in 2026. A collector goes on the network and discovers what is there.
Vendor-specific LogicModules for NetApp, Dell EMC, Pure and HPE then get applied without anyone writing a check by hand.
The automation genuinely works, and time to value is short. The trade-offs are the usual SaaS ones.
Data leaves your network, customizing a LogicModule is harder than editing a template, and hybrid unit accounting means the invoice moves as the estate does.
Pros
- Onboarding a mixed estate takes days rather than weeks.
- Storage, network, server, cloud and container monitoring share one platform.
- Published starting prices make an initial estimate possible without a call.
Cons
- Hybrid unit pricing gets expensive at scale. The real number still needs a quote.
- SaaS only, which rules it out for air-gapped and some regulated environments.
- Deep customization of a LogicModule is more work than the automated setup implies.
10. Zabbix
Best for: Teams with Linux skills, spare engineering hours and no license budget.
Rating: 4.3/5 on G2, 4.4/5 on Gartner Peer Insights.
Pricing: The software is free with no device or metric limits. Commercial support starts around $325 per month. Zabbix Cloud starts at $50.
Zabbix will monitor any storage device that speaks SNMP or answers a script. In practice that means all of them. Official and community templates cover NetApp, Dell EMC, HPE, Synology and S.M.A.R.T. drive health. The time-series engine handles a large estate without complaint.
The cost lands on your team instead of your budget. Someone has to build the templates and tune the triggers. Someone owns the database and the patching.
We have watched a Zabbix rollout stall for a quarter after the one person who understood it left. With the right people in house that is a fair trade. Without them it gets expensive.
Pros
- No license cost at any scale, which changes the maths for large estates.
- Customization is effectively unlimited if someone will write it.
- Self-hosting suits air-gapped and heavily regulated environments.
Cons
- Setup and ongoing maintenance take real engineering time that rarely gets costed.
- Storage analysis has to be built. The product ships no opinion about what good looks like.
- Dashboards are functional rather than polished, and stakeholders notice.
What Changed in Storage Monitoring for 2026
The supply side of storage changed this year, and it changes what you should ask a vendor. For most of the past decade, a filling pool was a paperwork problem.
You saw 85 percent used and raised a purchase order. Drives landed in a few weeks.
That loop broke when AI data centers absorbed the output of the drive industry. According to Tom's Hardware, enterprise hard drives went onto backorder by as much as two years as hyperscalers locked up supply. Some buyers moved to QLC SSDs they had never budgeted for.
Demand did not soften either. According to IDC, enterprise storage systems spending grew 22.9% in the first quarter of 2026.
Three things follow if you run storage on your own floor.
Forecast horizons have to stretch: A 30-day warning is now far too late, because 30 days does not cover a lead time measured in quarters.
Reclamation stopped being housekeeping: Orphaned volumes, stale snapshots and thin provisioning overcommit are the only capacity you can add this quarter.
Tiering became a financial decision: Moving cold data down a tier defers a purchase you may not be able to make on schedule.
We tell buyers to test this in a trial. Reading it off a feature list proves nothing. Load six months of history and pick your busiest pool. See how far ahead the tool projects it. A straight line through the last four weeks is not capacity planning. It is a chart.
What Should You Look for in Storage Monitoring Software?
Five checks settle most evaluations here. They are ordered by how often each one decides the outcome.
Vendor coverage against your actual rack: Get the supported device list and check your exact model numbers, not the brand names. Support for a vendor rarely means support for every array that vendor ships.
Depth below the volume: Confirm the tool reads LUNs, pools and fabric ports. A percentage-full number tells you nothing about why writes are queuing.
Correlation with compute: Decide early whether you need storage answers or infrastructure answers. If your team owns the hosts and the network too, this is the deciding check. A tool that stops at the array sends you to a second console mid-incident.
Forecasting method: Ask how much history the projection needs. Then ask about seasonality, because month-end batch runs make a naive trend line useless.
Deployment constraints: Air-gapped sites and data residency rules knock out several tools here. Check those constraints first, not last.
The stakes justify the work. According to the Uptime Institute Annual Outage Analysis 2026, 57% of organizations said their most recent major outage cost more than $100,000. One in five put the figure above $1 million, for the second year running.
One thing we would deprioritize is the storage monitoring dashboard itself. Every tool here demos well, and screenshots are the least reliable part of any evaluation. What matters is how a tool behaves during a 40-alert storm at three in the morning.
Which Storage Monitoring Tool Is Right for Your Team?
Most teams land in one of five situations. The table below maps each to a starting point.
Your Situation | Start With | Why |
You already monitor network and servers and want storage in the same place | Motadata ObserveOps | One platform and one data store remove the console hopping that slows down root cause work |
Storage is its own team with its own budget and a mixed-vendor estate | SolarWinds Storage Resource Monitor | The deepest dedicated multi-vendor array coverage outside the hardware vendors themselves |
Your arrays are almost all IBM or almost all Dell | IBM Storage Insights or Dell AIOps | Vendor-native depth at no extra cost when you already hold a support contract |
Your workloads are cloud-native and containers, not SAN | Datadog | Storage metrics land beside the traces and container data that explain them |
You have engineering time and no license budget | Zabbix | No limits on devices or metrics, at the cost of building and owning the templates |
If two rows describe you, run both trials on the same month of data. Paper comparisons here flatter whichever vendor writes the better documentation, and they tell you very little about how a tool behaves on your estate.
Rows one and two are the real fork: a dedicated array tool, or a unified observability platform that carries storage alongside everything else.
Pick the Best Storage Monitoring Software for Your Business
Choosing the best storage monitoring software comes down to one question. It has nothing to do with features. Who gets paged when storage misbehaves?
If that is a dedicated storage team, buy the deepest array tool you can afford and accept that you will run a second console.
If the same people own the network and the servers, the answer changes. A tool that stops at the array costs you time on every incident.
The honest trade here is that no single product wins both ways. A vendor-native tool always reads its own hardware more deeply than a platform can.
What a broader infrastructure monitoring platform buys instead is a shorter path from symptom to cause. In our experience, that is where the hours actually go.
FAQs
What is the difference between storage monitoring and storage resource management?
Storage monitoring watches health and performance in real time. It alerts you when something breaks. Storage resource management focuses on allocation, reclamation and planning over longer periods. Most tools here do both, with the balance tilted one way or the other.
Can one tool monitor SAN, NAS and cloud storage in the same console?
Yes, though fewer do it well than claim to. Cloud storage monitoring often needs a separate plugin or license, so check that before you assume the single view is included. ObserveOps collects SAN, NAS, virtual and cloud storage as supported infrastructure types on one platform.
Is free storage monitoring software good enough for production?
It depends on where the free version comes from. Free storage monitoring tools split into two groups. Vendor tools bundled with a support contract are production-grade within their own hardware. Open-source options only work if someone on your team owns the templates, the database and the upgrades.
Do you need an agent on the storage array to monitor it?
You do not need one on the array itself. Arrays are monitored agentlessly through SNMP, SMI-S or a vendor API, since you cannot install software on the controller. Agents matter on the hosts consuming that storage, where ObserveOps uses MotaAgent for per-second metrics.
Is Motadata ObserveOps better than SolarWinds for storage monitoring?
It depends on scope. SolarWinds Storage Resource Monitor goes deeper on array internals as a dedicated module. ObserveOps Infinity fits better when storage is one part of an estate you monitor as a whole. One edition covering every module also beats several separate licenses.
Author
Ramya Shah
Technical Writer
Ramya Shah is a technical content writer with a computer engineering background and roots in automotive journalism. He covers IT Service Management, observability, IT operations, and AI-driven automation. An early adopter of AI-assisted writing workflows, he turns complex IT processes into clear, engaging content optimized for search and answer engines (AEO), lifting content output and organic visibility.