9 Best Log File Analysis Tools for IT and DevOps Teams
An incident is open and the evidence is scattered. The application logs point to a connection timeout; the load balancer shows nothing unusual, and the container that produced the original error was replaced eighteen minutes ago. Three engineers are logged into three separate hosts running the same search, and the log line that would explain it has already rotated away.
That is the moment most teams start shopping for a log file analysis platform. Choosing one is harder than it looks, because the differences that matter are rarely the ones on the feature list.
This guide compares nine platforms against the same criteria. Before we get into them, here is what it covers:
The problem: Log data spread across servers, containers, network gear and cloud services, with no single place to query it.
What we compare: Nine platforms across source coverage, search depth, deployment flexibility, cost predictability and what happens after an alert fires.
Verified pricing: Every price checked against the vendor's own live pricing page, with the billing basis stated.
Where each one fits: Which platform suits self-managed infrastructure, which suits Kubernetes, which suits Windows-heavy compliance work.
When you don't need one: The point at which native tooling stops being enough, named plainly.
By the end, you will know which two or three platforms belong on your shortlist and which you can rule out before the first demo call. Most of this ground overlaps with log monitoring, so if you already run monitoring, you are further along than you think.
What Are Log File Analysis Tools?
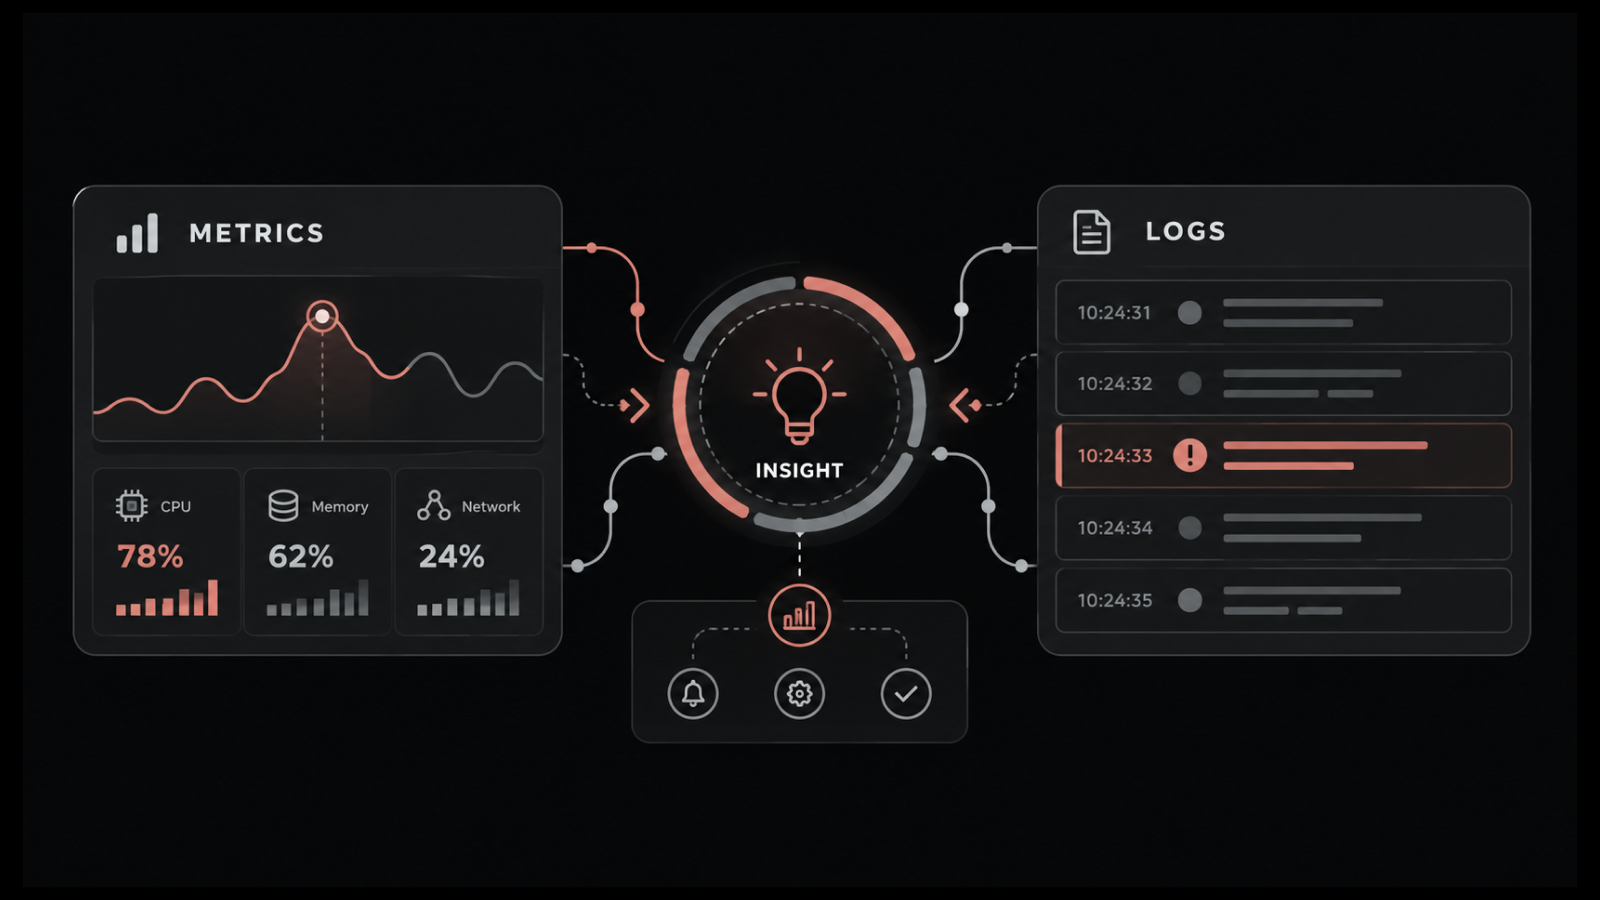
Log file analysis tools collect log data from servers, applications, containers, network devices and cloud services, then parse, index and make it searchable from one place. Also called log analysis software or a log analyzer, they turn raw text streams into something you can query, chart and alert on.
The category covers four distinct kinds of products. Comparing prices across them without accounting for that difference produces numbers that do not mean the same thing.
Local file viewers: A log viewer tool is a desktop application that opens and tails individual files. Useful for reading a single multi-gigabyte file quickly, with no server infrastructure involved.
Collection and routing agents: Tools like Fluentd, Vector and NXLog that gather log data from sources and forward it onward. They move and shape data rather than analyze it.
Centralized log platforms: Systems that ingest from many sources, apply parsing rules, index the results and provide search, dashboards and alerting. Often called log management tools, this is what most people mean by the term.
Full observability platforms: Platforms that treat logs as one signal alongside metrics, traces and topology, so an investigation can move between them without switching tools.
Most platforms accept syslog as a baseline, then add vendor-specific formats through parsers. The quality of that parser library determines how much configuration work lands on your team in week one. If you want the mechanics, we cover log parsing and log aggregation separately.
How Do SEO Log File Analyzers Differ from IT Log Analysis Tools?
SEO log file analyzers differ from IT log analysis tools in what they read, what they answer and who buys them. Both can parse the same Apache or NGINX access log, which is where the confusion starts.
SEO log file analyzers | IT log analysis tools | |
What they read | Web server access logs only | Server, application, container, network and cloud logs |
What they answer | How search engines crawl the site | What happened across the systems, and why |
Who buys them | SEO and marketing teams | IT, DevOps and security teams |
Retention needed | Weeks of crawl history | Months to years, often set by regulation |
On the SEO side, sometimes called web log analysis software, Screaming Frog and Semrush are the recognized names, and most lists of the best SEO log file analysis tools name both. This guide covers the operational side, so if you came looking for log file analysis tools for SEO or crawl analysis, those two are the better place to start.
How We Evaluated These Tools
We scored each enterprise log analysis platform against five weighted criteria drawn from what actually determines whether a log platform earns its cost over a two-year horizon.
Source coverage, 30%: How many log types the platform ingests without custom work. Syslog, Windows Event Log, container output, cloud service logs, network device logs and application output all count separately.
Search, parsing and correlation depth, 25%: Whether parsing happens at ingest or at query time, how the query language handles high-cardinality data, and whether the platform can relate a log event to something else that happened at the same moment.
Deployment flexibility, 20%: SaaS, self-hosted, or both. For regulated sectors, this criterion often eliminates candidates before any feature is scored.
Cost predictability at volume, 15%: How the bill behaves when log volume triples. Per-GB, per-event, per-node, and fixed-license models all fail differently.
What happens after the alert, 10%: Whether detection ends at a dashboard or hands off to a ticket with an owner and a clock.
What we did not test: Sustained ingest benchmarks at terabyte-per-day scale, every integration in each vendor's catalogue, or regional support responsiveness. We also did not run each platform through a full production migration, which is where the real operational differences surface. Treat this as a shortlisting exercise rather than a substitute for proof of concept.
Anyone standing up a platform for the first time will find our notes on centralized logging and on how logs and metrics differ worth reading alongside this.
Log File Analysis Tools Compared
Tool | Best For | Deployment | What It Analyzes | Pricing Basis | G2 Rating |
Motadata ObserveOps | Unified observability across hybrid infrastructure | On-premises or cloud | Logs, metrics, network flows, topology | Quote-based | 4.7/5 |
Splunk | Enterprise search depth and security analytics | Cloud or self-managed | Logs, security events, metrics | Workload or ingest, quoted | 4.4/5 |
Elastic Stack | Teams with platform engineering capacity | Cloud, serverless or self-managed | Logs, metrics, traces, search | Resource-based, from $99/month | 4.5/5 |
Graylog | Centralized log management on a fixed license | Self-managed or Graylog Cloud | Logs, security events | Annual license, from $15,000/year | 4.4/5 |
Grafana Loki | Kubernetes and cloud-native workloads | Self-hosted or Grafana Cloud | Logs, with Grafana for metrics | Free OSS, cloud from $19/month | 4.5/5 |
Datadog | Cloud-native environments already using APM | SaaS only | Logs, APM, infrastructure, security | $0.10/GB ingest plus indexing | 4.4/5 |
Sumo Logic | SaaS analytics with a security requirement | SaaS only | Logs, metrics, traces, SIEM | Credits, from $0.15 per credit | 4.3/5 |
ManageEngine EventLog Analyzer | Windows-heavy environments and audit reporting | On-premises or cloud | Windows and Linux logs, device logs | Per log source, from $795 | 4.5/5 |
SolarWinds Observability | Broad platform coverage with logs included | SaaS or self-hosted | Logs, infrastructure, applications | From $8 per node/month | 4.3/5 |
Detailed Reviews of Log File Analysis Tools
Each log file analysis tool below is reviewed against the same five criteria, with pricing taken from the vendor's own live pricing page in July 2026 and a cons block on every platform, including our own.
1. Motadata ObserveOps
Best for: Organizations running hybrid infrastructure that need logs analyzed alongside metrics, flows and topology in one platform.
Rating:
G2 - 4.7/5
Gartner Peer Insights - 4.6/5
Capterra - 4.7/5
ObserveOps ingests logs from servers, applications and network devices, parses them at ingest through a library of pre-built parsers covering Microsoft, Apache, IIS and firewall sources, and makes them searchable through Log Explorer. Machine learning clusters similar events together, which surfaces the anomalous ones without anyone writing a regex first. Live Log Trail gives you a real-time view during an active incident.
What separates it from a logs-only product is what happens next. Because logs, metrics, flows and topology live on the same platform, an alert on a log pattern can be checked against interface counters and dependency maps in the same window. It deploys on-premises for organizations whose data cannot leave their own infrastructure, which for banking, government and healthcare buyers is frequently the deciding factor.
Pros
- Logs analyzed in the same platform as metrics, flows and topology, so investigations stay in one place
- On-premises deployment available for data residency and sovereignty requirements
- Parser library reduces configuration work in the first weeks
- Alerting can hand off to a ticket rather than stopping at a dashboard
Cons
- Pricing is quote-based, so budgeting requires a conversation rather than a public calculator
- The platform is strongest where consolidation is the goal; teams wanting a logs-only point tool may find the breadth more than they need
- Deployment model is a decision to make at the start rather than a switch to flip later
- Proprietary in-house log formats need a custom parser built
Pricing: Quote-based, with on-premises and cloud options. A free trial and a demo are both available.
Our approach to unified log analytics and to anomaly detection covers the reasoning behind the design in more depth.
2. Splunk
Best for: Large enterprises with mature security operations and the budget to match.
Rating:
G2 - 4.4/5
Gartner Peer Insights - 4.4/5
Capterra - 4.5/5
Note that these ratings are drawn from Splunk's broader review profiles rather than a standalone Splunk Platform log analytics listing.
Splunk remains the reference point for the category. Its Search Processing Language handles ad-hoc investigation across enormous datasets better than most alternatives, and the app ecosystem covers more sources than anyone else ships. Security teams in particular get years of accumulated detection content.
The trade-off is cost and complexity. SPL takes real time to learn well, and Splunk Platform pricing is not published, so budget conversations start with a sales call rather than a calculator. At high ingest volumes, it is consistently among the most expensive options in this comparison.
Pros
- Query capability that handles investigations other platforms struggle with
- Largest ecosystem of integrations and community content in the category
- Strong track record at very high ingest volumes
- Mature security tooling for teams running a SOC
Cons
- Among the highest total cost in the category at scale
- SPL has a genuine learning curve before a team is productive
- Self-managed deployments carry significant administration overhead
- Splunk Platform carries no published list price, which slows early budgeting
Pricing: Splunk Platform is quoted under either Workload Pricing or Ingest Pricing, with no list price published. Splunk Observability Cloud, which includes Log Observer Connect, starts at $15 per host per month for Infrastructure above 15 hosts, $60 for App and Infra and $75 for End-to-End, all billed annually. A free trial is available.
3. Elastic Stack
Best for: Teams with platform engineering capacity who want control over their own logging pipeline.
Rating:
G2 - 4.5/5
Capterra - 4.6/5
Elasticsearch, Logstash, Kibana and Beats have been the default self-managed logging stack for over a decade, and the reason is flexibility. You control the ingest pipeline, the index lifecycle, the retention tiers, and the visualizations. Self-managed Elasticsearch carries no license fee.
That flexibility comes with an operating cost measured in engineering time. Shard sizing, rollover policies and cluster tuning are specialist work, and a badly tuned cluster fails in ways that are hard to diagnose under incident pressure. Elastic Cloud removes much of that burden at a published price.
Pros
- Self-managed deployment carries no license cost
- Published cloud pricing, which is unusual in this category
- Very large community and integration ecosystem
- Full control over parsing, indexing and retention behavior
Cons
- Running a production cluster reliably requires specialist skills
- Storage costs climb quickly if retention policies are not tiered
- Licensing terms have changed more than once in recent years
- Feature availability varies significantly across subscription tiers
Pricing: Elastic Cloud Hosted starts at $99 per month for Standard, $114 for Gold, $131 for Platinum and $184 for Enterprise, based on a production configuration of 120 GB storage across two zones, with usage-based pricing above that. Self-managed Elasticsearch is a free download. A 14-day free trial is available.
For Linux log management specifically, self-managed Elasticsearch and other Linux log analysis tools are where most teams start.
4. Graylog
Best for: Teams that want centralized log management on a predictable annual license rather than a per-gigabyte meter.
Rating:
G2 - 4.4/5
Gartner Peer Insights - 4.5/5
Capterra - 4.6/5
Graylog occupies useful middle ground. The Open edition is free and self-hosted, handling Syslog, CEF, GELF, Beats, HTTP-JSON, IPFIX, Netflow and plain text out of the box, with pipelines and streams for routing data where it needs to go. Plenty of mid-sized teams run it for years without ever paying.
The paid editions add the pieces that matter at scale: the correlation engine, custom reports, data tiering across hot, warm and archive, and the Illuminate content library of parsers. Graylog publishes floor prices, which makes early budgeting easier than with most competitors, though the actual figure depends on licensed volume.
Pros
- Free Open edition is genuinely usable in production
- Fixed annual license rather than a per-gigabyte meter that scales with volume
- Floor pricing published openly on the vendor's site
- Data routed to the Data Lake does not count against the license
Cons
- The Open edition supports a very limited set of parsers, per Graylog's own comparison table
- The correlation engine, scheduled reports and data tiering are all Enterprise-only
- The jump from free to $15,000 per year is a large step for smaller teams
- Graylog Cloud pricing is not published
Pricing: Graylog Open is free. Graylog Enterprise starts at $15,000 per year and Graylog Security at $18,000 per year, both paid annually. Cloud pricing is quoted.
5. Grafana Loki (Grafana Labs)
Best for: Kubernetes and cloud-native workloads where log volume is high and full-text search matters less than cost.
Rating:
G2 - 4.5/5
Gartner Peer Insights - 4.6/5
Capterra - 4.6/5
Loki takes a deliberately different approach. Rather than indexing the full text of every log line, it indexes only a small set of labels and stores the rest compressed in object storage. The result is a dramatically lower storage cost at volume, which is exactly what log analysis tools for Kubernetes need to manage.
The compromise is search behavior. Queries that filter on labels are fast; queries that scan log content across a wide time range are slower than an index-everything platform. LogQL is capable but takes adjustment if your team is used to SPL or Lucene syntax.
Note that Loki has no standalone review profile, so the ratings above are for the Grafana Labs platform it ships within.
Pros
- Storage costs stay manageable at very high log volume
- Fits naturally into environments already running Grafana and Prometheus
- Open source with no license cost for self-hosting
- Label model maps cleanly onto Kubernetes concepts
Cons
- Full-text search across long time ranges is slower than indexed alternatives
- Gets most of its value when paired with Grafana rather than standing alone
- Self-hosted operation requires object storage and retention management
- Free-tier log retention runs to 14 days, so compliance retention needs a paid plan
Pricing: Loki is open source and free to self-host. Grafana Cloud has a permanently free tier with 14-day log retention, a Pro tier from $19 per month plus usage with volume discounts and 30-day log retention, and an Enterprise tier starting at a $25,000 per year spend commitment.
6. Datadog
Best for: Cloud-native teams already using Datadog for APM and infrastructure monitoring.
Rating:
G2 - 4.4/5
Gartner Peer Insights - 4.6/5
Capterra - 4.6/5
Datadog's argument for log management is correlation. If your traces and infrastructure metrics already live there, adding logs means an investigation can move from a latency spike to the trace to the log line without leaving the interface. It ships out-of-the-box parsing for more than 200 log sources.
Pricing is where teams get caught out. Ingestion and indexing are billed on two separate meters in two different units, and indexing scales with event count and retention period rather than with data volume. The Flex tiers help with long-retention data, though they add another dimension to manage.
Pros
- Correlation across logs, traces and metrics is genuinely well executed
- Large integration catalogue with minimal configuration required
- Published pricing with clearly stated billing units
- Flex tiers make long retention more affordable than standard indexing
Cons
- Two separate meters for ingestion and indexing make forecasting difficult
- Costs escalate sharply as log volume grows
- SaaS only, with no self-hosted option for data residency requirements
- Retention tiers and exclusion filters need active management to control spend
Pricing: Log ingestion is $0.10 per ingested or scanned GB per month, billed annually. Standard indexing is $1.70 per million log events per month at 15-day retention, billed annually or $2.55 on-demand. Flex Logs Starter is $0.60 per million events stored per month. Forwarding to custom destinations starts at $0.25 per GB outbound per destination. A free trial is available.
7. Sumo Logic
Best for: Cloud-first organizations that need log analytics and SIEM capability from the same SaaS platform.
Rating:
G2 - 4.3/5
Gartner Peer Insights - 4.3/5
Capterra - 4.6/5
Sumo Logic was built as a SaaS platform from the start, which shows in how quickly it stands up. Log analytics, metrics, tracing and Cloud SIEM all run from the same service, and every paid tier includes unlimited named users. For a growing SOC that last detail matters more than it sounds.
The credit model takes some study. You buy credits, and different operations consume them at different burn rates, so forecasting means understanding your workload mix rather than just your gigabytes per day. Sumo Logic publishes its full credit schedule, which is more transparency than most competitors offer.
Pros
- No per-seat charge, so analyst headcount does not drive the bill
- Full credit burn rate schedule published openly
- Security and observability workloads run from one platform
- Fast to stand up, with no infrastructure to manage
Cons
- The credit model makes cost forecasting harder than a flat per-GB rate
- Regional deployments carry uplifts of 10% to 40% above US pricing
- Annual fees increase by 10% at renewal unless separately agreed
- SaaS only, with no self-hosted option
Pricing: Credits-based. List price per credit for US deployment on annual terms is $0.15 for Essentials, $0.2125 for Enterprise Operations, $0.225 for Enterprise Security and $0.25 for Enterprise Suite. Regional uplifts range from 10% to 40%. A free tier and a 30-day free trial are available.
The distinction between what a log platform does and what a SIEM does is worth understanding before you buy either, and we cover SIEM platforms separately.
8. ManageEngine EventLog Analyzer
Best for: Windows-heavy environments where audit reporting and compliance evidence are the primary drivers.
Rating:
G2 - 4.5/5
Gartner Peer Insights - 4.3/5
EventLog Analyzer earns its place through depth in a specific area. Windows Event Log auditing, Active Directory change tracking, privileged user monitoring and file integrity monitoring are all handled with more granularity than general-purpose platforms bother with. The compliance report packs cover PCI DSS, HIPAA, GDPR, SOX and ISO 27001 out of the box.
It is less at home in cloud-native architecture. Container and Kubernetes coverage lags behind platforms designed for that world, and the interface shows its age next to newer entrants. For an organization whose auditors ask for specific reports on a schedule, that matters less than it might.
Pros
- Compliance reporting is ready to run rather than requiring configuration
- Strong coverage of Windows, Active Directory and perimeter device logs
- On-premises deployment keeps audit data inside your own infrastructure
- Priced per log source, which is easier to forecast than per-gigabyte models
Cons
- Container and cloud-native log coverage is behind purpose-built alternatives
- Interface feels dated compared with newer platforms
- Correlation across non-Windows sources is less developed
- The Free Edition omits log parsing, event correlation and file integrity monitoring, so it works mainly as an archive
Pricing: Licensed by number of log sources, meaning devices, applications, servers and workstations added for monitoring. The Free Edition covers up to 5 log sources. The Professional Edition starts at $795, with an endpoints package covering 100 endpoints for $245. A 30-day free trial with all premium features is available.
If Windows sources dominate your environment, our breakdown of Windows event logs covers what to collect and why.
9. SolarWinds Observability
Best for: Teams that want log analysis as one component of a broader infrastructure and application monitoring platform.
Rating:
G2 - 4.3/5
Gartner Peer Insights - 4.3/5
SolarWinds Observability brings logs together with infrastructure monitoring, application performance and network visibility under one platform, available as SaaS or self-hosted. For organizations already running SolarWinds products, the log module fits into a familiar operating model with familiar administration.
Log analysis here is one module among many rather than the product's centre of gravity. Teams whose primary requirement is deep log investigation will find the search and correlation capabilities less developed than in platforms built specifically for it. The breadth is the point, and the depth follows from that.
Pros
- Single platform covering logs, infrastructure, applications and network
- Both SaaS and self-hosted deployment models offered
- Familiar operating model for existing SolarWinds customers
- Hybrid environments are well handled rather than treated as an edge case
Cons
- Log search and correlation are less developed than in log-first platforms
- Module structure means capabilities are spread across separate purchase
- SaaS pricing is quoted rather than listed, unlike the self-hosted edition
- Broad platform scope can mean paying for coverage you do not need
Pricing: SolarWinds Observability Self-Hosted starts at $8 per node per month with volume discounts available, and the SaaS edition is quoted. Both offer a fully functional 30-day trial.
Which Log File Analysis Tool Fits Which Situation?
The log file analysis tool that fits your situation is decided mostly by three things: what your infrastructure runs on, whether your data is permitted to leave it, and whether an alert has to end as a resolved ticket. The table below reads from the situation rather than from the product. It also carries the trade-off each choice commits you to, so the fit and the cost of that fit sit side by side.
Your situation | Strongest fit | Trade-off to weigh |
Log data is not permitted to leave your own infrastructure | Motadata ObserveOps | Quote-based, scoped to what you deploy |
Alerts have to close as tickets with an owner and an SLA clock | Motadata ObserveOps | Strongest where consolidation is the goal |
A mature SOC running complex investigations across huge datasets | Splunk | Highest total cost of anything here at volume |
Platform engineers on staff and a preference for owning the pipeline | Elastic Stack | Running the cluster reliably needs specialist skills |
A fixed annual license rather than a meter that scales with volume | Graylog | The free edition ships very few parsers |
Kubernetes at volume where storage cost is the binding constraint | Grafana Loki | Full-text search across long ranges is slower |
Traces and infrastructure metrics already in one SaaS platform | Datadog | Two billing meters make forecasting difficult |
SaaS log analytics with a security operations requirement alongside | Sumo Logic | The credit model is harder to forecast than per-GB |
Windows and Active Directory dominate and auditors set the requirement | ManageEngine EventLog Analyzer | Container and cloud-native coverage is lighter |
Logs wanted as one part of a wider monitoring platform | SolarWinds Observability | Log search is one module rather than the focus |
A handful of servers, one environment, and a 30-day retention need | Native tooling is enough for now | You give up correlation across sources |
Do You Really Need a Dedicated Log Analysis Tool?
Often, no.
On a small number of servers, the command-line tools already installed on the machine answer most questions faster than any platform will. Searching a log file directly, watching it update in real time, or reading the system journal covers a lot of ground. A single application on a single host does not need an indexing pipeline. Cloud-native teams operating entirely inside one provider get a long way on CloudWatch Logs, Azure Monitor or Cloud Logging without adding a vendor.
There are three points where that stops holding, and they are worth naming precisely.
1. Correlating a failure across more than a handful of hosts:
The moment an investigation requires someone to line up timestamps from four machines manually, you have crossed the line. Native tools do not correlate across sources, and manual correlation under incident pressure is where efforts to reduce MTTR stall.
2. Retention obligations that outlive the default window:
Native cloud logging services have retention defaults measured in days or weeks. If your regulator expects a year of audit logs retrievable on request, you need a platform with a retention and archive tier.
3. Anyone outside the platform team needing an answer
Command-line tools work fine for the three people who know the syntax. Once a support lead, a security analyst or an auditor needs to query logs directly, you need a query interface, access controls and saved searches.
Retention is where this bites hardest. IBM's 2025 Cost of a Data Breach Report puts the mean time to identify and contain a breach at 241 days, the lowest figure in nine years of the study. If your log data only reaches back 30 days, an investigation into something that started eight months ago has nothing to work with.
If none of those three apply, native tooling is enough for now. If two of them do, start shortlisting. The related question of where log management ends and SIEM and logging begins is worth settling at the same time.
What Should You Look for in a Log File Analysis Tool?
Six criteria separate a platform that earns its cost from one that becomes shelfware.
Source coverage without custom work: Count the log types you actually have, then check how many the platform parses out of the box. Every source needing a custom parser is engineering time you have not budgeted.
Parsing at ingest rather than at query time: Platforms that structure data on the way in return results faster and cost less to query. Those that defer parsing shift the cost to every search you run.
A cost model that matches your growth pattern: Per-gigabyte pricing punishes verbose logging. Per-event pricing punishes high-frequency, low-volume events. Fixed licenses punish small teams. Pick the failure mode you can live with.
Correlation with other signals: A log line explains what an application reported. Whether the underlying cause was network, storage or capacity requires other data in the same view.
Deployment and residency options: If your data cannot leave your infrastructure or your country, this criterion eliminates most SaaS-only platforms before feature comparison starts.
Where the alert lands: An alert that fires into a channel nobody owns has no assignee and no resolution time recorded against it. Check whether detection can be handed off to a ticket with an assignee and an SLA clock. Our guidance on selecting a platform goes deeper on the evaluation process.
What Are Log Analysis Best Practices?
Log analysis best practices come down to six decisions, here they are:
1. Decide What to Log Before You Decide Where to Store It
Teams routinely point everything at a new platform and meet the bill three months later. What you send is the first lever on cost, because debug-level output from a chatty service is often 80% of volume and 5% of value.
List each source and the question its logs actually answer
Drop or sample the high-volume, low-value output before it reaches the platform
Set logging levels per environment, keeping production out of debug by default
Turn debug on temporarily during an investigation, then off again
2. Standardize Timestamps and Formats at the Source
Correlating events across systems depends entirely on trusting the clocks and reading the fields the same way everywhere. This is inexpensive to set up and decide whether cross-system correlation is possible at all.
Run NTP on every host so timestamps agree
Log in UTC and format timestamps as ISO 8601
Emit structured logs, such as JSON, wherever you control the application
Standardize field names for common values like host, severity and source
3. Parse at Ingest Rather Than at Query Time
Extracting fields when data arrives means every later search runs against structured data. Deferring that work to query time means paying the cost again on every search, for the life of the deployment.
Parse and extract fields at ingest, not at query time
Use the platform's pre-built parsers wherever they exist
Write custom rules only for genuinely proprietary formats
Categorize logs at this stage so log categorization stays consistent downstream
4. Set Retention by Obligation Rather Than by Storage Cost
Different log data serves different purposes and deserves different retention. Tiering it correctly is the largest available lever on cost, since instantly-searchable storage is the most expensive kind.
Keep operational troubleshooting data hot for around 30 days
Hold security and compliance data for a year or more in cheaper tiers
Map each category onto hot, warm and archive storage
Record the choices in your retention policies so auditors get a straight answer
5. Correlate Logs with Metrics and Traces Before You Alert
A log-only alert says a service reported an error. It cannot say whether the cause was the service, the network path, the storage layer or a noisy neighbor on the same host, and that gap is where false positives come from.
Require corroboration from a metric or trace before an alert fires, where you can
Use event correlation across signals to cut noise
Reserve high-urgency pages for alerts confirmed by more than one signal
Review which rules fire most and tune the ones that page without cause
6. Route the Alert to a Ticket Rather Than an Inbox
An alert in a shared mailbox or a busy channel has no owner and no clock, so nobody is accountable and nothing records how long resolution took. Routing it into the service desk fixes both.
Send each log alert to the service desk as a ticket
Give every ticket an assignee, a priority and an SLA
Track resolution time so repeat incidents become visible
Consolidate duplicate alerts into one ticket to hold down alert fatigue
How Do You Choose the Right Log File Analysis Tool?
You choose the right log file analysis tool by scoring two criteria first, then validating the shortlist with a proof of concept on your own data. The situation table above gives you a shortlist. These two criteria tell you which name on it to back.
Feature depth, query language and price per gigabyte are the obvious things to score, and they matter. The two criteria below decide more deployments, and both can be answered before you book a demo.
Where the alert ends: Nearly every platform will detect a pattern and raise an alert. Far fewer will hand that alert to a service desk as a ticket with an owner, a priority and a clock running against an SLA. Detection that stops at a dashboard leaves the assignment, tracking and closure work manual.
Whether it can deploy where the data must live: For banking, government, healthcare and defense buyers, data residency eliminates candidates before a single feature is scored. Several of the platforms in this comparison are SaaS-only, which makes them non-starters for those buyers regardless of how they score elsewhere.
We built ObserveOps around both of those constraints because we spent years working with Indian enterprises who could not use a SaaS-only platform and who needed detection to connect to service management. Score those two criteria before anything else. Both eliminate candidates outright, which is worth knowing before you invest time in a demo.
Turn Scattered Log Data Into Faster Resolution With Motadata ObserveOps
There is a trade-off worth naming here. If your environment lives entirely inside one cloud provider and your retention requirement is measured in weeks, the native logging service may be all you ever need. Plenty of teams have run that way for years, and adding a platform would be spending money to solve a problem they do not have.
That situation rarely stays true. Acquisitions bring legacy infrastructure. Regulators extend retention requirements. A network device or an on-premises database appears in the architecture and stops producing logs the cloud service can read. The point at which log data spans more than one environment is the point at which a single searchable platform stops being optional.
Motadata ObserveOps was built for that moment. Logs, metrics, network flows and topology analyzed together, parsers ready for common enterprise sources on day one, machine learning that clusters events instead of waiting for someone to write the right regex, and deployment on-premises or in the cloud depending on where your data is allowed to live. Detection connects through to a ticket, so an alert has an owner and a clock rather than a dashboard and a hope.
FAQs
What are the best tools for log file analysis?
It depends on where your data is allowed to live and what your infrastructure runs on. Elastic Stack and Graylog suit self-managed deployments, Grafana Loki suits Kubernetes at volume, Datadog and Sumo Logic suit cloud-native SaaS environments, and Motadata ObserveOps suits hybrid infrastructure that cannot use a SaaS-only platform. Score residency and source coverage first.
Are there free log file analysis tools?
Yes. The main open source log analysis tools are Graylog Open, Grafana Loki and self-managed Elasticsearch, all with no license cost, and GoAccess is free for web server access logs. You still supply the infrastructure and the engineering time to run them.
What is the difference between log analysis and SIEM?
Log analysis collects log data and makes it searchable for troubleshooting, performance monitoring and incident investigation. SIEM adds security detection rules, threat intelligence enrichment and compliance reporting on top of that foundation. Many platforms now do both, so buying a SIEM for an operational problem often means paying for capability you will not use.
How does Motadata ObserveOps compare with Splunk for log analysis?
It depends on your environment. Splunk has deeper ad-hoc query capability and a larger ecosystem, which matters most for a mature SOC investigating across enormous datasets. Motadata ObserveOps fits better where logs, metrics, flows and topology need one platform, where deployment must stay on-premises, and where cost predictability outweighs query flexibility.
What should you check before buying a log analysis platform?
Six questions, in this order. Can it deploy where your data is legally required to live, how many of your sources does it parse without custom work, does it parse at ingest or at query time, how does the bill behave when volume triples, can it correlate logs with metrics and traces, and does an alert become a ticket with an owner. The first question eliminates most candidates.
Author
Poonam Lalani
Content Strategist
Poonam Lalani is a B2B content strategist and writer with a background in computer engineering and experience across enterprise technology domains, including AI, cloud, DevOps, data engineering, and IT operations. She specializes in creating research-driven content that simplifies complex ideas and supports product education, thought leadership, and business growth.