All Features
Hybrid Infrastructure Monitoring
Linux Network Monitoring
Linux network monitoring keeps track of interface traffic, packet errors, connections and retransmissions on your Linux hosts, which helps admins catch a bottleneck or a failing link early. With Motadata ObserveOps, you can collect that data over SSH without an agent or run MotaAgent on the host, and get alerts based on thresholds, learned baselines and forecasts.
What Does Linux Network Monitoring Cover?
Linux network monitoring is the continuous collection of network metrics from Linux hosts, covering traffic on each interface, packet errors, connection counts and the network services the host runs. Many organizations run their web, application and database tiers on Linux, so a slow or saturated host interface delays every service and transaction behind it.
Motadata ObserveOps lets you monitor network traffic on Linux hosts, and the health of that traffic, from one console. The scope of this page is the network layer of the host:
Interface traffic: Bytes in and out per second on each network interface
Packet health: Error packets and TCP retransmissions that point to loss or a faulty link
Connections: TCP and UDP connection counts, plus the source and destination of each monitored process
Network services: Linux DHCP scopes, pools and leases through a dedicated integration
Host health metrics such as CPU, memory, disk, load average and file growth are covered on the Linux server monitoring page.
How Do You Check Network Traffic on Linux from the Command Line?
You can check network traffic on a single Linux host with iproute2 commands, which ship with major distributions, and with the sysstat package, which you may need to install. Use the commands below when you need a quick answer about one host.
Command | What it tells you | Comes from |
ip -s link show eth0 | Bytes, packets, errors and drops received and sent on one interface | iproute2 |
ss -s | Summary of open TCP and UDP sockets by state | iproute2 |
nstat -az TcpRetransSegs | Total TCP segments retransmitted since the counter last reset | iproute2 |
sar -n DEV 1 5 | Traffic per interface every second, five samples | sysstat |
sar -n EDEV 1 5 | Errors and drops per interface every second, five samples | sysstat |
ping -c 4 10.0.0.10 | Whether a host answers and its round-trip time | iputils |
On older systems you'll still see the netstat command in use, though most distributions now favor ss. Each of these checks covers one host at the moment you run it, so a fleet of Linux hosts needs centralized collection, history and alerting.
How Does ObserveOps Collect Network Data from Linux Hosts?
ObserveOps collects network data from Linux hosts in two ways: agentless over SSH, or through MotaAgent installed on the host. Both paths feed the same monitors, dashboards and alert policies.
Agentless Collection over SSH
The agentless monitoring path needs no software on the host. Setting up a host takes three steps:
Create an SSH credential profile: Enter the SSH username with a password or a private key, plus the passphrase if the key has one. Use Test to confirm the profile connects before you save it.
Create a discovery profile: Add a single IP, a host name, an IP range, a CIDR block (a range written in slash notation, such as 10.0.0.0/24) or a CSV file, then select the credential profile. SSH port 22 is the default, and a ping check runs unless you turn it off for hosts that block ICMP.
Provision the discovered hosts: Select the hosts from the discovery results and add them as monitors, and ObserveOps begins collecting metrics from them continuously.
On Ubuntu, install the sysstat package, which supplies system statistics, before discovery. ObserveOps has documented integrations for Red Hat Enterprise Linux, Ubuntu and SUSE Linux, and all three expose the same network interface metrics.
Agent-Based Collection with MotaAgent
Where you prefer agent-based collection, install MotaAgent on the Linux host and turn on its Network Metrics setting. Loopback or test adapters can be left out of monitoring through the Excluded Interfaces field.
Because the agent registers each host by its host name, a changed IP address doesn't break monitoring. And if the connection to ObserveOps goes down for a while, the agent keeps what it collected on the host for a set period, so a brief outage doesn't leave you without monitoring data.
Which Linux Network Metrics Does ObserveOps Track?
On every monitored Linux host, ObserveOps tracks traffic per interface and for the host as a whole, along with error packets, TCP and UDP connections and TCP retransmissions. In practice, that gives you a Linux network traffic monitor for each interface, with history saved for trend analysis.
The KPIs in the table below come from the RHEL, Ubuntu and SUSE integrations.
Metric | KPI name | What it tells you |
Interface inbound traffic | system.network.interface.in.bytes.rate | Bytes received per second on each interface |
Interface outbound traffic | system.network.interface.out.bytes.rate | Bytes sent per second on each interface |
Interface total traffic | system.network.interface.bytes.rate | Combined bytes per second in and out of each interface |
Host network traffic | system.network.bytes.rate | Bytes sent and received per second for the whole host |
Error packets | system.network.error.packets | Total error packets seen on the host |
TCP connections | system.network.tcp.connections | Number of open TCP connections |
UDP connections | system.network.udp.connections | Number of UDP connections |
TCP retransmissions | system.network.tcp.retransmissions | Lost or damaged packets that the host had to send again |
These metrics are most useful read together:
Retransmissions rise while traffic stays flat: This usually points to packet loss or congestion on the path, which slows every application that depends on the host.
Interface throughput climbs week after week: The link is heading toward its limit, and the per-interface rates work as a Linux bandwidth monitor that shows which interface carries the load.
Connection counts jump suddenly: Check the process connections described in the next section to see which service opened them.
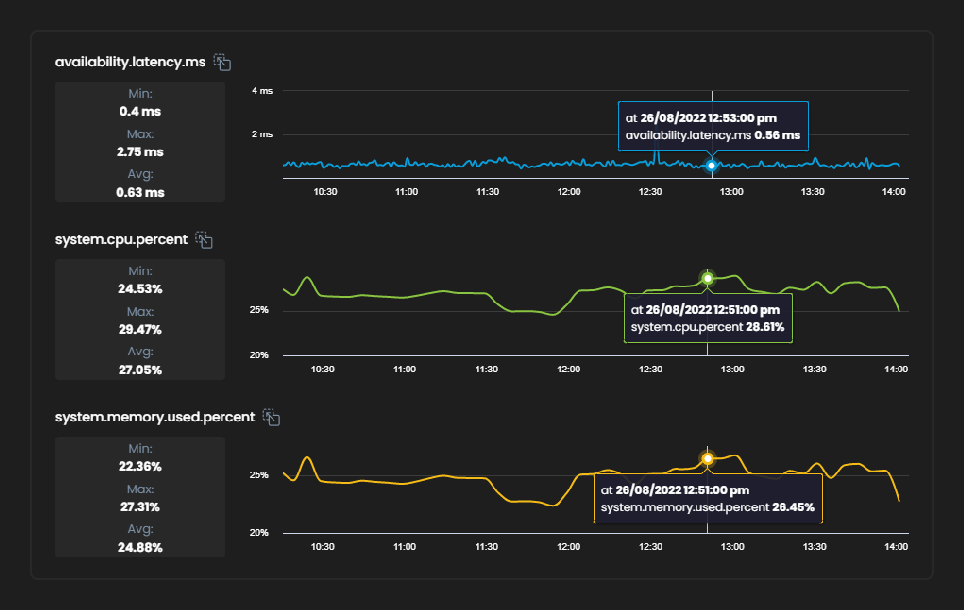
Switch and router ports are collected over SNMP and covered on the network interface monitoring page. Below is the key performance metrics view ObserveOps shows for a monitored Linux host.
Monitor Linux Network Services and Process Connections
Traffic volume tells you how busy a host is. Network services and process connections tell you what it's doing on the network. ObserveOps covers both through dedicated KPIs.
Linux DHCP Server Monitoring
DHCP hands out IP addresses from a scope, the range a server is allowed to assign, and each assignment is a lease that expires after a set time. Once a Linux DHCP server has no free addresses left, new laptops, phones and servers can't get on the network. The Linux DHCP monitoring integration tracks the signals that warn you first:
Scope and pool usage: Utilization and free percentage for every DHCP scope and pool
Address counts: Active, available, abandoned and leased IP addresses
Lease details: Binding state, start and end time, client host name and hardware Ethernet address
Setup needs the names of the DHCP configuration file and the lease file, plus credentials with root access or permission to read both. Make sure the DHCP service is running, and check that its process and service names match the version you're monitoring.
Process-Level Network Connections on Linux
For each monitored process on a Linux host, ObserveOps records where its connections start and end: source IP and port, destination IP and port. So when connection counts climb, you can see which service owns them and where they lead.
Alert on Linux Network Health and Availability
ObserveOps uses two kinds of policy for Linux network alerts. Availability policies check whether a host is up, and metric policies check how its network is behaving. Either one can apply to a single monitor, a group, a tag or every host.
Availability Alerts for Linux Hosts
An availability policy fires when a Linux host monitor, or an instance on it, goes down. You decide how long the outage has to last inside an evaluation window and how many Down results in a row confirm it, which keeps one missed poll from turning into an alert. Uptime is reported for every host too, so unplanned restarts are easy to spot.
Metric Alerts for Linux Network Traffic
Metric policies come with three severity levels (Critical, Major and Warning) and four alert types:
Threshold Alert: Fires when a metric crosses a value you set, such as TCP retransmissions above a fixed count. You can require several consecutive breaches within a time window, so only sustained breaches raise an alert.
Baseline Alert: Fires when a metric drifts from its learned normal range for the current time of day and day of week. Set the deviation as an absolute value or as a percentage.
Anomaly: Detects unusual behavior without a fixed threshold, which suits traffic with strong daily patterns. It needs at least 8 hours of polling data per metric and evaluates every 15 minutes.
Forecast: Learns from the past 24 hours of data and alerts before a metric reaches the value you define.
On top of metrics, anomaly policies cover log and flow data, and the anomaly detection page explains how they apply to network devices. Alerts can go out by email, Microsoft Teams or Slack, or start a runbook such as the Top 10 Process runbook for Linux, which follows up with an email listing the top process details. If you use Motadata ServiceOps, a policy can declare an incident through an integration profile and open a ticket there.
Report on Linux Network Trends and Capacity
Linux network reports show how much each host's traffic has grown and where it's heading. That gives capacity and budget decisions a basis in measured trends. Dashboards and reports in ObserveOps all draw on the same stored history:
Custom dashboards: Interface traffic, retransmissions and connection counts side by side for a group of hosts
Trend and forecast reports: Historical trend, forecast and capacity forecasting reports for planning reviews
Sharing: Reports that run on a schedule, arrive by email and export as PDF, XLSX or HTML
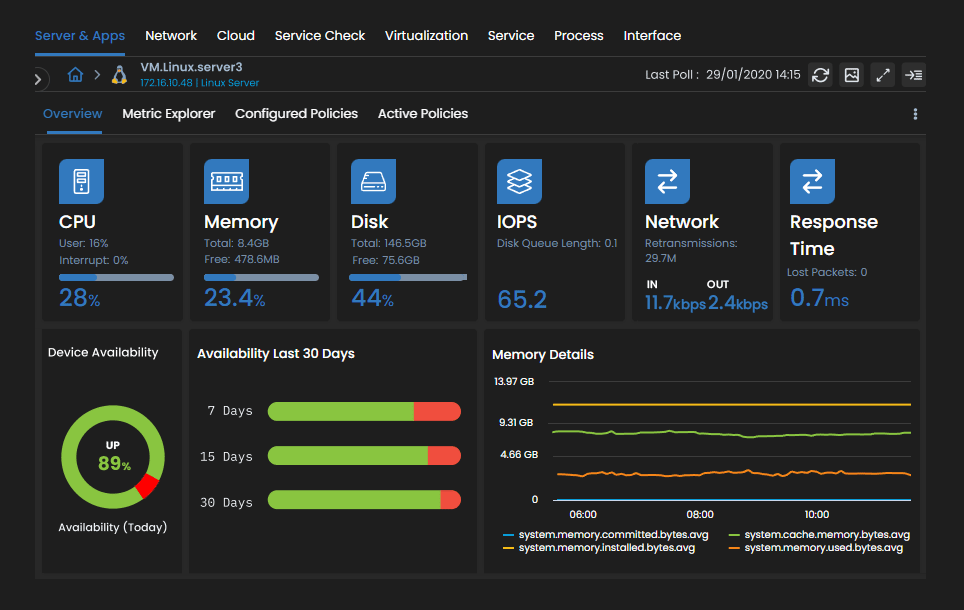
Capacity forecasting extends this view across compute, storage and network resources, and ObserveOps Log Monitoring centralizes Linux system logs next to these metrics. The dashboard below shows a Linux host view in ObserveOps.
Get Complete Linux Network Visibility with Motadata ObserveOps
Command-line Linux network monitoring tools work well for a quick look at one host's live traffic. Once you're running many hosts, though, you need Linux network monitoring software that gathers the same signals centrally, stores the history and alerts the right people when a pattern shifts.
ObserveOps brings interface traffic, packet errors, connections, DHCP health and process connections into one console, with agentless SSH collection or MotaAgent for each host. Teams comparing network monitoring tools for Linux get threshold, baseline, anomaly and forecast alerts on the same data they use for capacity reports.
Ready to implement Linux Network Monitoring?
Discover how Motadata ObserveOps can help you monitor your infrastructure in real-time and respond to issues instantly.