Top 10 Riverbed Alternatives for Faster Network Troubleshooting and Fewer Consoles
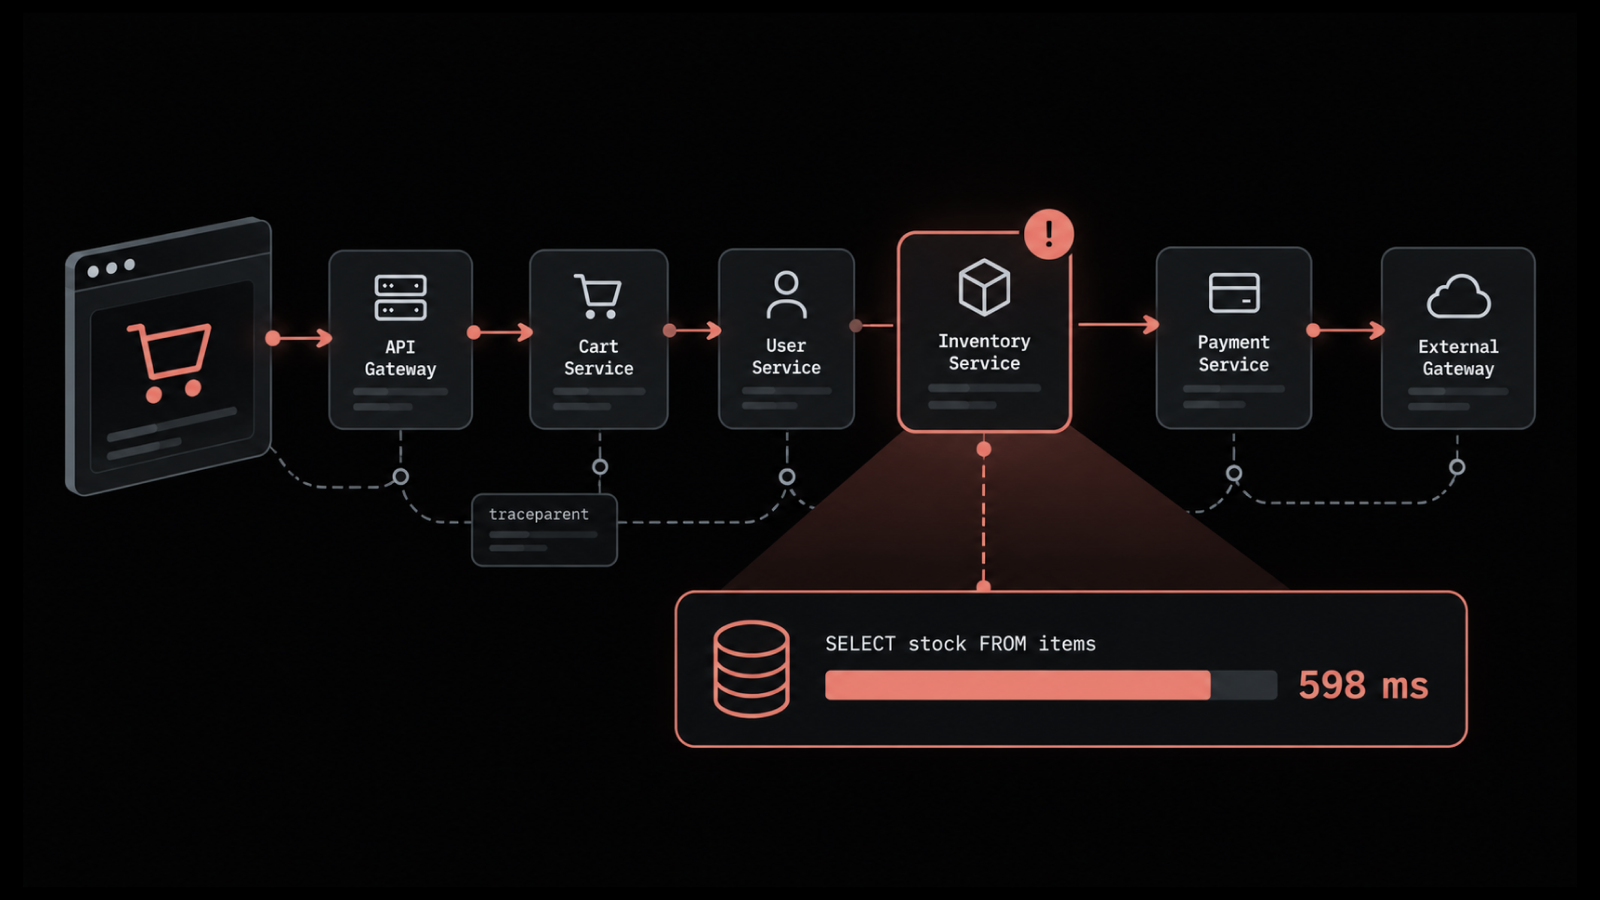
Why does finding the cause of one slow application still mean opening several Riverbed consoles, exporting data from each and lining up timestamps across them? For many network operations groups, each type of evidence lives in a separately licensed product, so every incident starts with reconciliation before diagnosis can begin.
The cost reaches well beyond engineering time. Outages run longer while evidence is pieced together, and renewals arrive product by product for appliances that see less of the traffic now running in cloud and SaaS. Add ownership changes and roadmap questions at renewal, and a routine renewal turns into a decision the finance team wants justified.
In this blog, you will see:
Why buyers move: Four common renewal triggers
Ten alternatives: Mapped to the Riverbed product replaced
Verified pricing: Billing basis stated for each
Buyer checks: Questions to ask every vendor
The goal is a shortlist built around the Riverbed products you run today, with each option judged on how it handles network flow analysis and what it will cost as your network grows. The right choice shortens root cause analysis and cuts the number of monitoring tools you renew each year.
What is Riverbed and Who Uses It?
Riverbed is a networking and observability vendor founded in 2002, known for SteelHead appliances that speed up application traffic between offices and for a network performance monitoring portfolio used to find the cause of slowdowns.
What it covers: NetProfiler for flow analysis, meaning summaries of which systems talked to each other and how much data moved; NetIM for device health; AppResponse for packet capture; Aternity for digital experience monitoring, meaning how responsive devices and applications feel to staff; and SteelHead for WAN acceleration
Who buys it: Large enterprises, carriers and public-sector bodies with distributed branch networks and a dedicated network operations function
How it runs: Physical and virtual appliances, on-premises software and SaaS, with each product typically licensed on its own
That profile shapes which Riverbed competitors belong on a shortlist, because most buyers replace one or two products and keep the rest. Buyers searching for Riverbed NPM alternatives usually mean the network monitoring products, which is where this guide focuses, with SteelHead covered in its own section. Each constraint described next is a structural choice that suits some organizations and works against others.
Why do Organizations Look for Riverbed Alternatives?
Organizations look for Riverbed alternatives when running several separately licensed monitoring products costs more in engineering hours and renewals than the visibility it returns.
1. Riverbed Network Evidence Split Across Separately Licensed Products
A single slowdown can need evidence from several Riverbed products. Each one has its own interface and upgrade cycle.
Flow records live in NetProfiler, interface data in NetIM and packets in AppResponse
Engineers switch consoles and align timestamps manually to rebuild one incident
Every product carries its own license, maintenance contract and renewal date
The cost appears as longer outages and a troubleshooting process that depends on specific people being available, which is the problem cross-domain correlation is meant to solve.
2. Riverbed Ownership and Roadmap Questions at Renewal
Riverbed's ownership has changed several times in the past decade, and its monitoring line has been renamed more than once. The products still work, yet procurement reasonably asks where future investment will go.
2015: Thoma Bravo took the company private
2021: A Chapter 11 restructuring reduced its debt
2023: Vector Capital completed its acquisition
Product names: The monitoring line has carried the SteelCentral and Alluvio names
Recent focus: New launches have centered on Aternity and AI features for employee experience
A renewal without a product-specific roadmap for NetProfiler or NetIM becomes a risk that finance and procurement both have to approve.
3. Riverbed Appliance Costs as Traffic Moves to the Cloud
Packet capture, the recording of network traffic for later analysis, was designed around links inside the data center. As workloads move to cloud and SaaS, a growing share of traffic never crosses the appliances being refreshed.
Hardware refresh cycles arrive whether or not coverage has kept pace
Cloud traffic needs flow logs or agents, which can mean yet another product
Storage for packet retention grows with every increase in link speed
Spending continues on the data center view while visibility into cloud-hosted services falls behind.
4. Riverbed Alerts That End Before a Ticket is Closed
Riverbed tools are good at telling an engineer something is wrong. The work that follows, from assigning an owner to recording the fix, usually happens in a separate service desk.
Alerts reach tickets through integrations or manual copying
Topology and change context rarely travels with the ticket
Service level agreement reports draw on two systems that record time differently
Each handoff adds minutes to resolution and gaps to the audit trail, and both feed the cost of downtime.
How We Evaluated These Riverbed Alternatives
Riverbed network observability alternatives in this guide were evaluated against five weighted factors, each tied to a cost the business pays, listed here in order of weight:
Network visibility depth: Flow analysis, SNMP polling, the standard way routers and switches report health, and path tracing; gaps here lengthen outages
Cross-layer correlation: Whether network data appears alongside server, application and log data, which decides how many engineering hours one incident consumes
Deployment flexibility: On-premises, private cloud and SaaS options, since a platform that breaks data residency rules creates audit exposure
Pricing model fit: Billing basis and how cost behaves as devices, traffic or retention grow, which drives renewal spend
Path from alert to resolution: Whether an alert becomes an assigned, tracked and closed ticket in the same platform, which affects both resolution time and audit readiness
Two terms recur in the reviews:
Flow records: Traffic summaries exported by network devices in formats such as NetFlow, sFlow, jFlow and IPFIX
Topology: A live network topology map of how devices connect, used to trace the effect of one failure on everything downstream
What we did not do:
Run a hands-on proof of concept of every platform in one lab environment
Review WAN optimization or SD-WAN platforms, which are covered separately below
Treat ratings as fixed, since G2, Gartner Peer Insights and Capterra averages move as reviews arrive; Gartner figures come from the Infrastructure Monitoring Tools market
Guarantee prices, which were read from each vendor's own pricing page in August and September 2026; confirm current rates with the vendor before committing
The choice between on-premises versus SaaS monitoring deserves early attention, because it removes some vendors before features are compared.
Riverbed Alternatives Compared at a Glance
The Riverbed alternatives below are compared side by side so the deployment limits and pricing basis that drive total cost are visible before any demo.
Tool | Best For | Deployment | Pricing | G2 Rating |
Motadata ObserveOps | Replacing NetProfiler and NetIM with one platform | On-premises, private cloud, public cloud | Quote-based | 4.6/5 |
NETSCOUT nGeniusONE | Packet forensics as an AppResponse replacement | Physical and virtual probes | Quote-based | 4.5/5 |
Kentik | Traffic analytics at carrier or cloud scale | SaaS | From $2,000 per month, billed annually | 4.8/5 |
Cisco ThousandEyes | Path visibility across internet, cloud and SaaS | SaaS with enterprise, cloud and endpoint agents | Quote-based annual subscription | 4.5/5 |
SolarWinds Observability | Hybrid device, server and application monitoring | Self-hosted, SaaS | From $8 per node per month, billed annually | 4.3/5 |
Datadog | Cloud-first network and infrastructure monitoring | SaaS | Network devices from $7 per device per month, billed annually | 4.4/5 |
Dynatrace | Application-first observability | SaaS, customer-hosted Managed | From $7 per host per month, annual commitment | 4.5/5 |
LogicMonitor | SaaS monitoring for hybrid networks | SaaS | From $16 per hybrid unit per month | 4.5/5 |
Paessler PRTG | Mid-sized networks with sensor-based licensing | On-premises | From $200 per month, billed annually | 4.7/5 |
Zabbix | Open-source monitoring with in-house expertise | Self-hosted, Zabbix Cloud | Free software, support from $325 per month | 4.3/5 |
Top 10 Riverbed Alternatives Reviewed
Each Riverbed alternative below is reviewed on the strengths and trade-offs that affect total cost and engineering effort, starting with Motadata ObserveOps.
1. Motadata ObserveOps
Best for: Organizations replacing NetProfiler and NetIM with one platform for network, application and log data, deployed on-premises or in the cloud
Rating:
G2 - 4.6/5
Gartner Peer Insights - 4.6/5
Capterra - 4.7/5
Motadata ObserveOps puts network and application monitoring in one platform. A traffic spike and a slow transaction can be read on the same timeline, which is where multi-console investigations usually lose time.
It runs on-premises or in the cloud, with collectors, lightweight polling servers at branch sites, forwarding data to a central server. Network analysis is flow-based by design, so segments that need full packet forensics are paired with a dedicated capture tool.
Pros
- One platform covers the flow, device and path roles that NetProfiler and NetIM split between them
- On-premises, private cloud, multi-site and high-availability deployments suit strict data residency rules
- Configuration management included alongside monitoring, useful when a change triggers the incident
- Alerts can continue into ServiceOps tickets, so an incident ends with an owner and an audit record
Cons
- Pricing is quote-based, so budgeting starts with a short scoping conversation
- Network analysis is flow-based; segments needing full packet forensics are usually paired with a capture tool
- Value is greatest where several monitoring tools are being consolidated
- The deployment model is best decided early, since on-premises and cloud rollouts are planned differently
Pricing:
Licensing: Quote-based, scoped to the environment and deployment mode
Trial: A 30-day free trial is available
2. NETSCOUT nGeniusONE
Best for: Organizations that depend on packet-level evidence and need a Riverbed AppResponse alternative for troubleshooting and forensics
Rating:
G2 - 4.5/5
Gartner Peer Insights - 4.4/5
NETSCOUT built its business on packet data. nGeniusONE is the analysis layer over its InfiniStreamNG appliances and vSTREAM virtual probes, and it uses deep packet inspection, reading the contents of network traffic, to turn captured packets into service-level views.
Visibility follows the probes. Extending it across branches or cloud segments adds hardware and storage to the budget, which is the main cost to model against an AppResponse renewal.
Pros
- Packet-level detail that flow-based tools cannot reproduce
- Long track record in large enterprises, carriers and government networks
- Strong for voice and unified communications troubleshooting
- Physical and virtual probes cover data center and private cloud segments
Cons
- Coverage extends only as far as the deployed probes
- Probe and storage costs rise with link speed and retention needs
- Getting full value from packet analysis calls for specialist skills
Pricing:
Licensing: Quote-based; NETSCOUT does not publish a price list
How to buy: Through NETSCOUT directly or its channel partners
3. Kentik
Best for: Large, cloud-heavy or carrier networks looking for Riverbed NetProfiler alternatives delivered as SaaS
Rating:
G2 - 4.8/5
Gartner Peer Insights - 4.9/5
Capterra - 4.6/5
Kentik was designed to analyze network traffic at very high volume, alongside the routing data that shows how traffic moves between internet providers. That makes it a strong fit for service providers and enterprises whose revenue depends on internet performance.
Kentik is now an Infoblox company, so older comparisons describe it as an independent vendor. It is delivered as SaaS on annual contracts with a published entry price. Server and log monitoring fall outside its focus, so most buyers run it next to another platform.
Pros
- Handles very high flow volumes from carrier and large enterprise networks
- Combines flow, routing and cloud traffic data in one network view
- Published entry pricing and a 30-day trial
- Useful for peering, capacity and traffic engineering decisions
Cons
- Entry price and annual-only contracts suit larger organizations best
- Delivered as SaaS, so strict on-premises data rules need confirming early
- Server, application and log monitoring require a separate platform
Pricing:
Pro: From $2,000 per month, billed annually
Premier: Quoted
Contract terms: Annual contracts only, with multi-year terms on request
Trial: 30 days
4. Cisco ThousandEyes
Best for: Organizations replacing Riverbed path and experience visibility for internet, SaaS and cloud-hosted applications
Rating:
G2 - 4.5/5
Capterra - 4.6/5
ThousandEyes measures the networks an organization depends on without owning them. Agents inside the organization and across cloud regions run synthetic monitoring tests and map every hop between a user and an application, including ISP segments.
That outside-in view complements internal monitoring. Device polling and flow analysis inside the data center still need another platform, so most buyers pair the two.
Pros
- Visibility into ISP, cloud and SaaS networks beyond the corporate edge
- Shows whether a slowdown belongs to the organization, its ISP or the application provider
- Fits naturally where Cisco networking is already standard
- Endpoint agents cover remote and hybrid workers
Cons
- No published pricing, and test-unit consumption takes planning to forecast
- Internal devices, flows and servers need a separate monitoring platform
- Value depends on how widely agents are deployed
Pricing:
Licensing: Annual subscription, quote-based
Basis: Test units for synthetics, per endpoint for endpoint agents, flows per second for traffic analysis
Trial: 15 days
5. SolarWinds Observability
Best for: Hybrid infrastructures looking at Riverbed NetIM alternatives with broad device, server and application coverage
Rating:
G2 - 4.3/5
Gartner Peer Insights - 4.3/5
SolarWinds Observability is the current platform behind SolarWinds network and systems monitoring, available self-hosted or as SaaS. Its network heritage shows in NetPath, its hop-by-hop path analysis, and in wide multi-vendor device support.
Capability is tiered across three editions priced per node on multi-year annual terms. The self-hosted product was previously marketed as Hybrid Cloud Observability and its rates changed recently, so comparisons quoting the older name or rates are out of date.
Pros
- Familiar to many network engineers, which shortens onboarding
- Broad multi-vendor device coverage
- Self-hosted option supports on-premises data requirements
- Fully functional 30-day trial
Cons
- Tiered editions make it important to confirm what each tier includes
- Subscription-only contracts on multi-year terms
- Recent rate and name changes mean older quotes may not match current terms
Pricing (self-hosted):
Essentials: From $8 per node per month
Advanced: From $14 per node per month
Premier: From $17.50 per node per month
Contract terms: Subscription only, billed annually on multi-year terms
Trial: 30 days, fully functional
6. Datadog
Best for: Cloud-first organizations adding network monitoring to an existing Datadog deployment
Rating:
G2 - 4.4/5
Gartner Peer Insights - 4.6/5
Capterra - 4.6/5
Datadog approaches the network from the cloud side. Cloud Network Monitoring maps traffic between hosts and services, while Network Device Monitoring polls routers and switches over SNMP.
Flow records arrive through a separate NetFlow product, and each capability is metered on its own. The model suits organizations already running Datadog for infrastructure and application monitoring, and it rewards careful cost modeling before several products are enabled.
Pros
- Network, infrastructure, application and log data in one SaaS interface
- Strong coverage of cloud-native and containerized environments
- Published per-product rates
- Large integration library
Cons
- SaaS only, so monitoring data leaves the organization's own infrastructure
- Separate metering for each product makes total cost harder to forecast
- On-demand rates run well above annual rates
Pricing:
Cloud Network Monitoring: $5 per host per month billed annually, $6 month-to-month, $7.20 on demand
Network Device Monitoring: $7 per device per month billed annually, $8.50 month-to-month, $10.20 on demand
NetFlow Monitoring: From $0.60 per million aggregated flow records per month, billed annually, at 15-day retention
Infrastructure Pro: $15 per host per month billed annually, $18 on demand
Free tier: Five hosts with one-day metric retention
7. Dynatrace
Best for: Application-led organizations replacing Riverbed Aternity or application monitoring use cases with full-stack observability
Rating:
G2 - 4.5/5
Gartner Peer Insights - 4.6/5
Capterra - 4.6/5
Dynatrace starts from the application and works outward. A single agent instruments each host automatically, and its AI engine maps dependencies to trace a slow transaction to the component responsible.
Network visibility is strongest where hosts carry the agent. Device-level flow analysis and SNMP polling rely on extensions, so many network operations groups keep a network-first tool alongside it.
Pros
- Transaction-level visibility for complex application portfolios
- Automatic discovery and dependency mapping
- One annual platform commitment spans capabilities
- Strong fit for large, fast-changing application environments
Cons
- Network device and flow analysis are narrower than in network-first tools
- Consumption-based pricing needs careful capacity modeling
- Full-Stack pricing scales with host memory, which raises the cost of large hosts
Pricing:
Foundation and Discovery: $7 per host per month, billed at $0.01 per host-hour
Infrastructure Monitoring: $29 per host per month, billed at $0.04 per host-hour
Full-Stack Monitoring: $58 per 8 GiB host per month, billed at $0.01 per gigabyte of host memory per hour
Commitment: Annual commitment at platform level under the Dynatrace Platform Subscription
Trial: 15 days
Note: The older per-8 GB host rate still quoted in some places has been retired, so confirm any quote uses the current rate card
8. LogicMonitor
Best for: Organizations moving from Riverbed NetIM to SaaS monitoring across on-premises and cloud infrastructure
Rating:
G2 - 4.5/5
Gartner Peer Insights - 4.6/5
Capterra - 4.6/5
LogicMonitor's LM Envision platform monitors on-premises and cloud infrastructure from one SaaS console, using lightweight collectors inside the customer network. Auto-discovery and a large template library shorten onboarding for mixed-vendor networks.
It moved to Hybrid Unit pricing in September 2025, where one unit covers one on-premises device or cloud instance and other resources convert at set ratios. Mapping that model against an existing NetIM inventory before requesting a quote avoids surprises.
Pros
- SaaS delivery removes monitoring server maintenance
- Broad out-of-the-box device coverage
- Published per-unit list rates
- 15-day trial on any package
Cons
- SaaS only, with no self-hosted option
- Hybrid Unit conversion needs modeling against the actual inventory
- AI event correlation is reserved for the top tier
Pricing:
Essentials: From $16 per hybrid unit per month
Advanced: From $27 per hybrid unit per month
Signature with Edwin AI: From $53 per hybrid unit per month
Basis: Starting monthly list rates at standard minimum quantities, with final pricing quoted
Trial: 15 days on any plan
9. Paessler PRTG
Best for: Mid-sized networks replacing Riverbed NetIM with sensor-based on-premises monitoring
Rating:
G2 - 4.7/5
Gartner Peer Insights - 4.5/5
Capterra - 4.6/5
PRTG counts everything in sensors, where one sensor is one measured value such as an interface's traffic. Starting small is easy, and built-in sensors cover most network devices and flow protocols.
Paessler moved from perpetual to subscription licensing in 2024, with one license key per server. Beyond roughly 1,000 devices, buyers are directed to a separate enterprise product, so larger Riverbed environments should size carefully.
Pros
- Quick to deploy and learn
- Clear, published tier pricing
- On-premises by default
- Permanent free edition for small environments
Cons
- Sensor counts climb quickly in larger networks
- Licenses cannot be combined on one server
- Cross-layer correlation is limited compared with observability platforms
Pricing:
PRTG 500: $200 per month paid annually, 500 sensors or about 50 devices
PRTG 1000: $358 per month paid annually, about 100 devices
PRTG 2500: $742 per month paid annually, about 250 devices
PRTG 5000: $1,300 per month paid annually, about 500 devices
PRTG 10000: $1,642 per month paid annually, about 1,000 devices
Freeware: 100 sensors, permanent
Trial: 30 days with no sensor limit
10. Zabbix
Best for: Organizations with in-house Linux and scripting skills replacing Riverbed NetIM with open-source monitoring
Rating:
G2 - 4.3/5
Gartner Peer Insights - 4.6/5
Capterra - 4.7/5
Zabbix is free, open-source software with no limits on monitored hosts or users. It polls network devices over SNMP and scales across remote sites through proxies, relay servers that collect data locally.
The trade-off is engineering time. Configuration and upgrades stay with the organization unless it buys a support subscription, and flow analysis requires third-party tooling.
Pros
- No license cost at any scale
- Self-hosted, so monitoring data stays on-premises
- Large community and template library
- Paid support available when needed
Cons
- No native flow analysis
- Setup and maintenance depend on in-house expertise
- The 2024 move to AGPLv3, an open-source license with source-sharing duties, affects anyone offering a modified version as a service
Pricing:
Software: Free under AGPLv3
Silver support: $325 per month, billed annually
Gold support: From $825 per month, billed annually
Platinum, Enterprise and Global support: Quoted
Basis: Support priced by response coverage and the number of Zabbix servers and proxies covered
Which Riverbed Alternative is Best for Your Use Case?
The best Riverbed alternative depends on which Riverbed product you are replacing and where your monitoring data is allowed to live.
Tool | Best for | Deployment | What it monitors | Trade-off to weigh |
Motadata ObserveOps | Replacing NetProfiler and NetIM together | On-premises, private cloud, public cloud | Flows, devices, topology, network paths, configurations, servers, applications, logs, real users | Quote-based pricing; packet forensics pairs with a capture tool |
NETSCOUT nGeniusONE | Replacing AppResponse packet forensics | Physical and virtual probes | Packets, application and voice service performance | Coverage and cost scale with probe deployment |
Kentik | Replacing NetProfiler at carrier or cloud scale | SaaS | Flows, internet routing, cloud flow logs, synthetic tests | High entry price on annual contracts; no server or log monitoring |
Cisco ThousandEyes | Path and experience visibility beyond the corporate edge | SaaS with enterprise, cloud and endpoint agents | Internet paths, SaaS and cloud reachability, endpoint experience | Needs a separate tool for internal devices and flows |
SolarWinds Observability | Replacing NetIM in hybrid infrastructures | Self-hosted, SaaS | Devices, interfaces, paths, traffic, servers, applications | Tier contents and multi-year terms need checking |
Datadog | Adding network views to a cloud-first Datadog footprint | SaaS | Cloud traffic, network devices, flows, hosts, traces, logs | Separate metering per product complicates forecasting |
Dynatrace | Replacing Aternity or application-led use cases | SaaS, customer-hosted Managed | Applications, hosts, services, real users, synthetic checks | Network device and flow depth trails network-first tools |
LogicMonitor | Moving NetIM-style monitoring to SaaS | SaaS | Devices, servers, storage, cloud, containers, flows | No self-hosted option; Hybrid Unit mapping needed |
Paessler PRTG | Replacing NetIM in mid-sized networks | On-premises | Devices, interfaces, flows and applications by sensor | Sensor counts climb fast; enterprise scale needs another product |
Zabbix | Replacing NetIM with open source | Self-hosted, Zabbix Cloud | Devices, servers and applications through templates | No native flow analysis; relies on in-house expertise |
Three questions separate these platforms once the feature lists start to look alike:
Ticket closure: Can you show one interface alert becoming an assigned, closed and reportable ticket without leaving the platform?
Deployment: Which customers in our jurisdiction run your platform on-premises today, and which features differ from the SaaS edition?
Coverage: Which network segments will we see through flow records, and which will need probes or packet capture?
The first question decides how much audit exposure each incident leaves behind, and the second decides whether a regulated network can use the platform at all. We built ObserveOps around both because they kept appearing in the regulated environments we work in across South and Southeast Asia, banking and telecom above all, where separate tools for monitoring and tickets were the norm.
How do Pricing Models Compare Across Riverbed Alternatives?
Pricing across Riverbed alternatives follows five distinct models, and the one that costs least depends on which variable grows fastest in your network.
Per device or node: SolarWinds Observability and Datadog Network Device Monitoring charge for each monitored device, so cost tracks inventory size
Per host or host memory: Dynatrace and Datadog Cloud Network Monitoring charge by host, and Dynatrace Full-Stack scales with host memory
Converted units or sensors: LogicMonitor hybrid units and PRTG sensors translate different resource types into one billable measure
Consumption: ThousandEyes test units and Datadog flow records rise with test frequency, traffic volume and retention
Platform tier or quote: Kentik publishes an entry tier, Motadata ObserveOps and NETSCOUT scope pricing to the environment, and Zabbix charges only for support
A branch-heavy network that keeps adding small sites grows device counts faster than traffic. A data center consolidation program does the opposite, pushing traffic volumes up while the device list shrinks.
Modeling both growth paths before shortlisting avoids a renewal quote nobody planned for. Our breakdown of Datadog pricing shows how quickly separately metered products add up once several are enabled.
How do You Migrate From Riverbed Without Losing Visibility?
Migrating from Riverbed works best as a parallel run, where the new platform proves its coverage before any appliance is switched off and before any maintenance contract is renewed.
Five steps keep the move controlled:
Inventory what each product does today: List every NetProfiler, NetIM and AppResponse use, including reports other departments depend on
Point flow exports at both collectors: Most routers and switches can send NetFlow or sFlow records to two destinations, so both platforms see identical traffic during the overlap
Rebuild topology and dependencies first: A current device map gives alerts the context engineers need and exposes devices the old inventory missed
Recreate alerts, dashboards and configuration baselines: Keep thresholds that still matter, retire the ones nobody acts on, and back up device settings through network configuration management before cutover
Retire appliances on the maintenance calendar: Align switch-off dates with Riverbed support renewals so no contract is extended for a product already replaced
A regional bank, for example, might run both platforms through one quarter-end close, when traffic peaks and reporting pressure is highest. If the new platform explains every incident in that window, the case for switching off the old consoles is easy to make.
What If You are Replacing Riverbed SteelHead?
A Riverbed SteelHead alternative is a separate purchase from the network performance monitoring tools above, because SteelHead speeds up traffic across the WAN while those tools measure it.
WAN optimization cuts bandwidth costs by removing repeated data and compressing what remains before it crosses a wide area link. Many organizations now meet that need through SD-WAN platforms, which steer traffic across several links according to application policy. Three routes appear most often on SteelHead replacement shortlists:
SD-WAN with built-in optimization: HPE Aruba EdgeConnect, Cisco Catalyst SD-WAN and Fortinet Secure SD-WAN
SASE platforms: Palo Alto Networks Prisma SD-WAN and Cato Networks, which pair SD-WAN with cloud-delivered security
Keeping SteelHead: Riverbed continues to focus on WAN acceleration, so some organizations keep SteelHead and replace only the monitoring stack
Whichever route you take, the WAN still needs measuring. Flow records and path data from the new edge feed the same observability platform, so the SteelHead decision and the monitoring decision can be made independently.
Monitor Your Entire Network Under One Platform With Motadata ObserveOps
Motadata ObserveOps consolidates the network monitoring roles that Riverbed splits across several products and runs wherever your data must stay. Every tool on this list still earns its place for a specific job, and a dedicated capture platform will serve packet forensics on a handful of critical links better than any consolidated tool.
The case for consolidation grows when every incident means reconciling separate consoles and a separate service desk. ObserveOps puts network and application evidence on one timeline and connects alerts to ServiceOps tickets, which makes it the platform to evaluate first when license sprawl and deployment control are the constraints.
FAQs
What is the best alternative to Riverbed?
The best alternative depends on which Riverbed product you are replacing, since flow analysis, device monitoring, packet forensics and WAN acceleration are separate categories. Start by mapping each Riverbed product in use to the capability it provides. Organizations replacing several monitoring products at once usually gain most from a unified platform such as Motadata ObserveOps.
Who owns Riverbed now?
Vector Capital completed its acquisition of Riverbed in July 2023 and appointed Dave Donatelli as chief executive. The company had earlier been owned by Thoma Bravo and restructured through Chapter 11 in 2021. Buyers renewing Riverbed contracts often ask for roadmap commitments covering the specific products they run.
What is Riverbed used for in networking?
Riverbed is used for WAN optimization, which speeds up application traffic across wide area links, and for network performance monitoring. Its monitoring products analyze traffic records, device health, packets and end-user experience. Network operations staff use them to find the cause of slowdowns and outages across branches and data centers.
Can a Riverbed alternative run on-premises?
Many can, including self-hosted open-source tools and commercial platforms built for regulated industries. A growing number of newer platforms are SaaS only, so confirm deployment options before building a shortlist. Motadata ObserveOps supports on-premises, private cloud and multi-site collector deployments for organizations with data residency rules.
What should a Riverbed replacement checklist include?
Start with support for the traffic formats your devices export and monitoring coverage for every device vendor you run. Then check that the pricing basis fits how your network grows and that the deployment model satisfies your regulator. The final check is whether an alert can end as a closed ticket inside the same platform.
Author
Poonam Lalani
Content Strategist
Poonam Lalani is a B2B content strategist and writer with a background in computer engineering and experience across enterprise technology domains, including AI, cloud, DevOps, data engineering, and IT operations. She specializes in creating research-driven content that simplifies complex ideas and supports product education, thought leadership, and business growth.