What Is AI Networking? The Two Pillars and Which One You Need
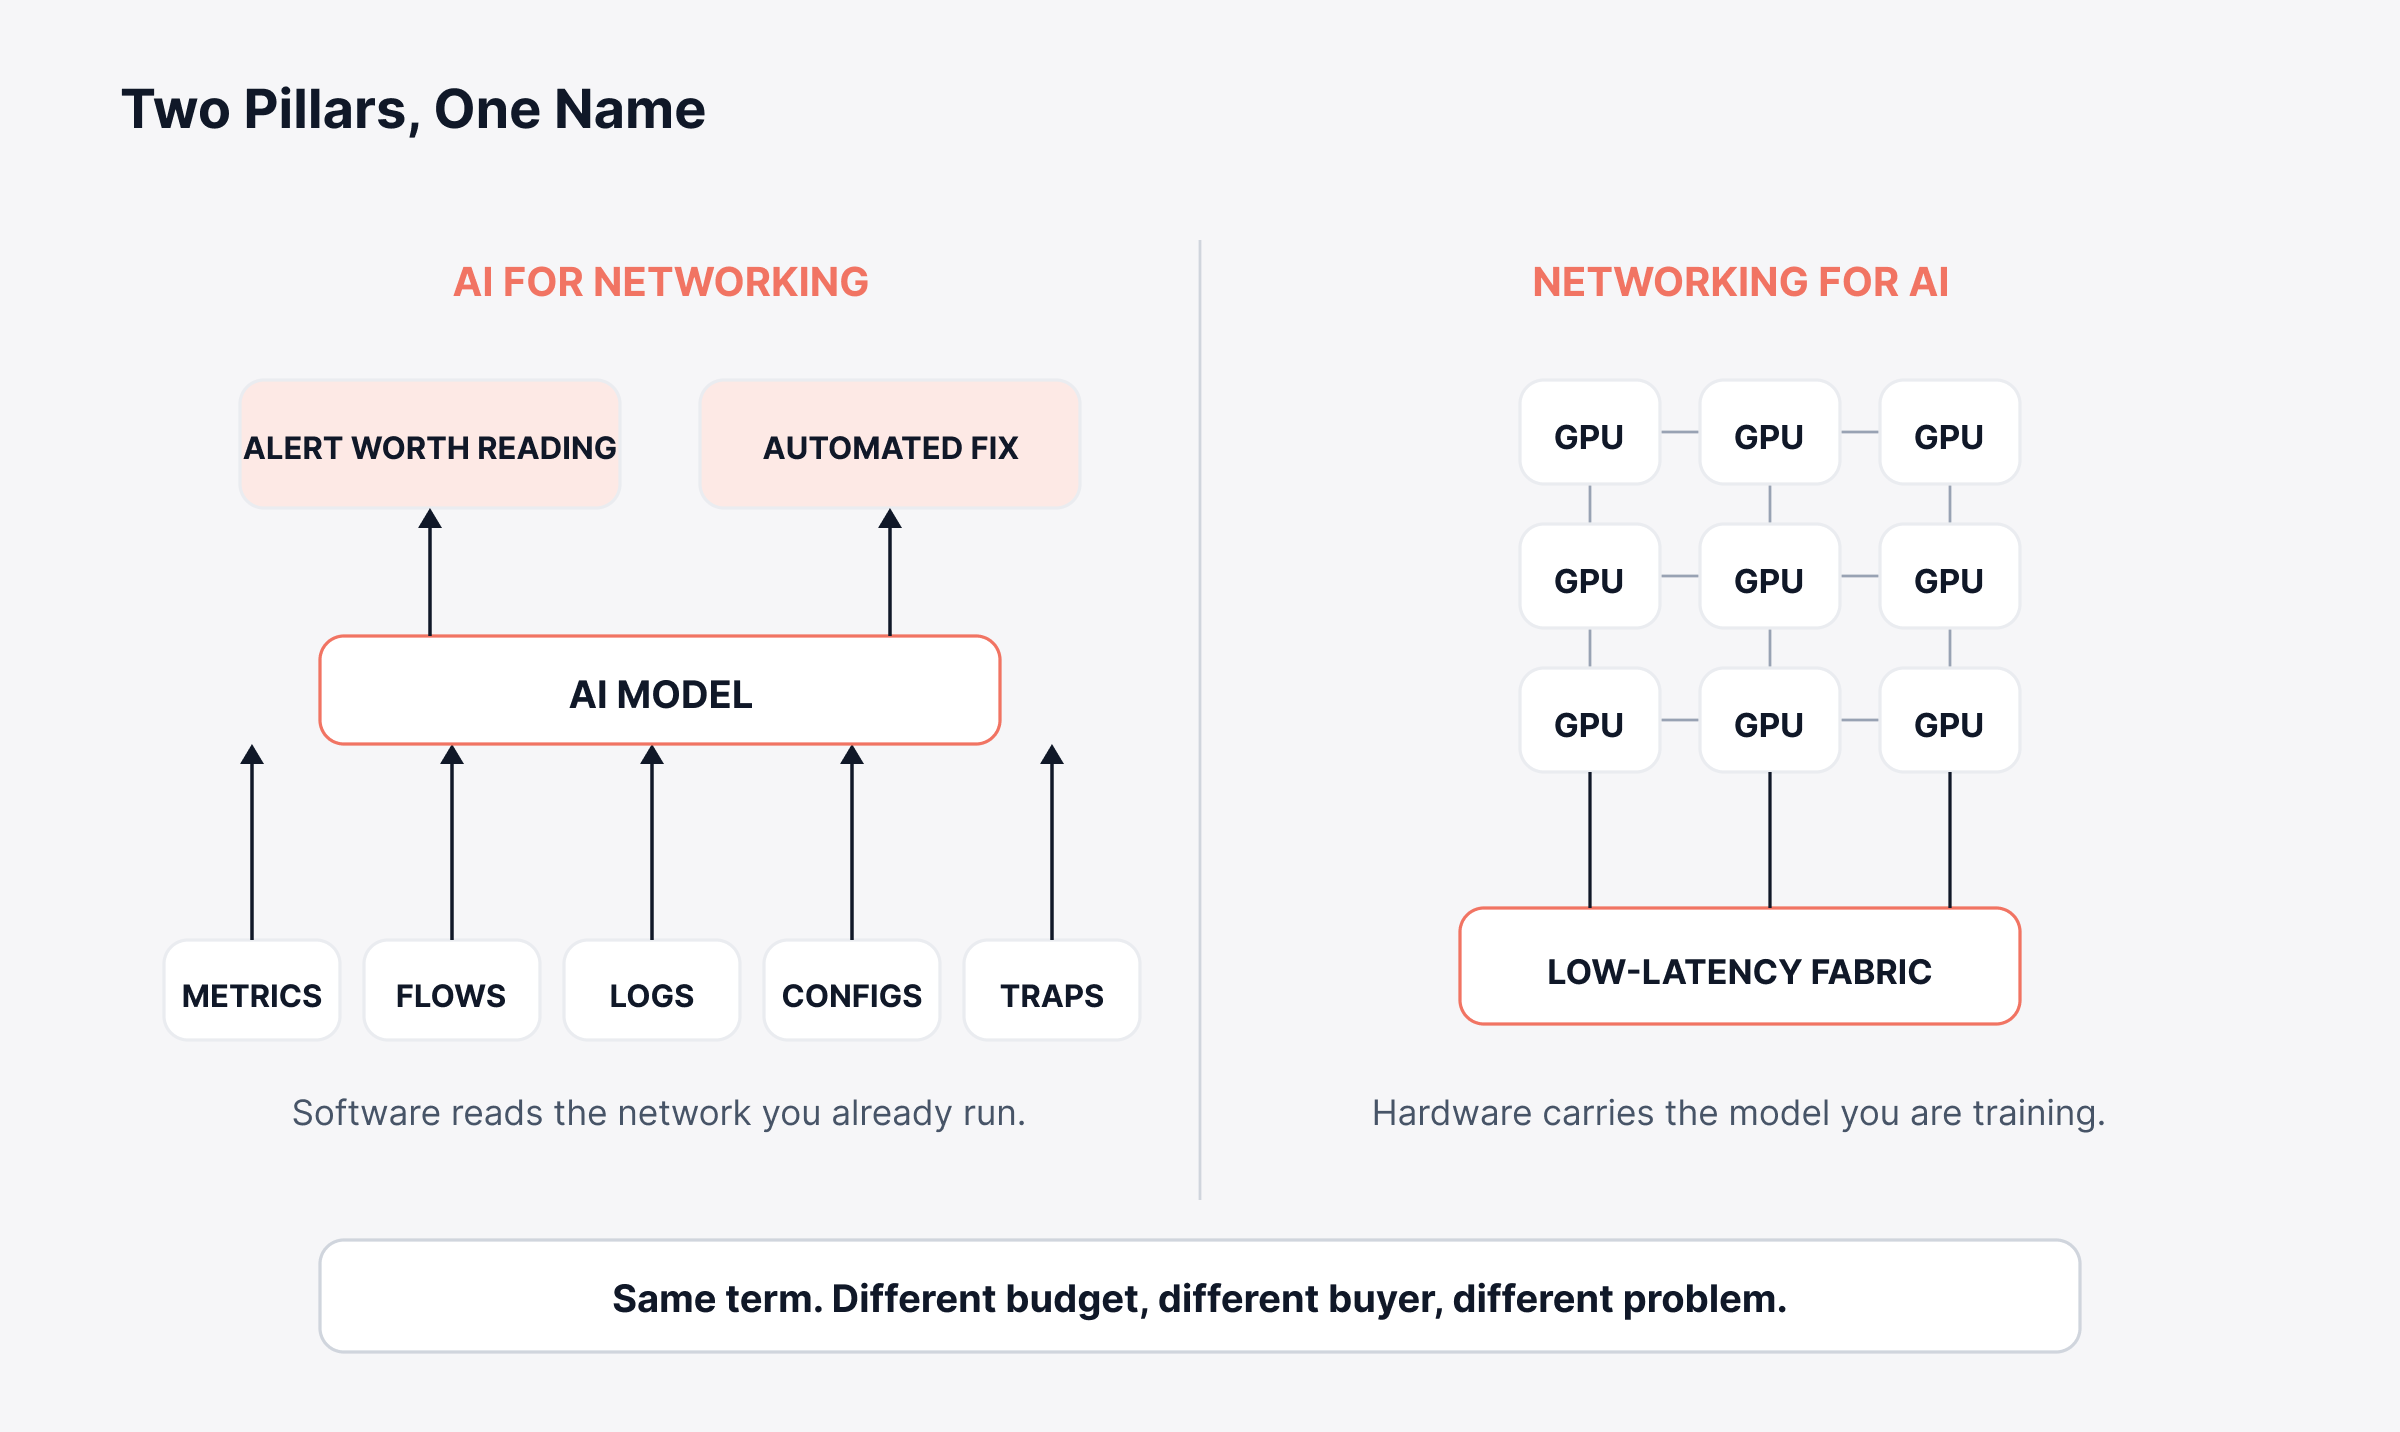
AI networking means two different things. Vendors rarely say which one they are selling. One is using AI to run the network you already have. The other is building network infrastructure fast enough to train AI models.
Both pillars are real, and they solve completely different problems. Most network teams only ever need the first.
In this blog, you will:
Tell the two pillars apart with a single question.
See what AI does to each signal your network already produces.
Learn where AI networking still falls short.
Work out why your polling interval caps what any model can detect.
You will finish knowing which pillar your own question belongs to.
What Is AI Networking?
AI networking is the use of artificial intelligence and machine learning inside computer networking. One term covers two separate practices.
The first applies AI to network operations. Your network already emits metrics, flow records, logs, configuration files, and traps. AI reads those signals and learns what normal looks like. It then flags or fixes what does not fit.
The second builds networks for AI workloads. Training a large model puts thousands of GPUs in constant conversation. Ordinary data center networking cannot keep pace.
The industry separates them as AI for networking and networking for AI. The two get discussed together constantly, which is where the confusion starts.
AI for Networking vs Networking for AI: What Is the Difference?
The two pillars differ on almost every dimension that matters to a buyer.
AI for networking | Networking for AI | |
What it means | Using AI to operate a network | Building a network to carry AI workloads |
The problem it solves | Too many alerts, too little context | GPUs sitting idle waiting for data |
What you buy | Software that reads your telemetry | Switches, optics, and fabric design |
Who needs it | Any team running a production network | Teams training or serving large models |
Typical budget owner | Network operations | Data center or platform engineering |
Measured by | Mean time to detect and resolve | Job completion time and GPU utilization |
One question settles which pillar you need. Are you trying to run your network better, or trying to run AI on top of it?
If the answer is the first, everything below the next heading applies to you. If it is the second, skip ahead to the infrastructure section.
What Does AI for Networking Do to Your Network Data?
AI for networking works on signals your network already produces. It needs no new instrumentation, just a model trained on your own traffic. Network anomaly detection works this way across device, traffic, and log behavior.
Each signal type gets handled differently. The five below cover most of what a network platform ingests.
1. Metrics and Thresholds
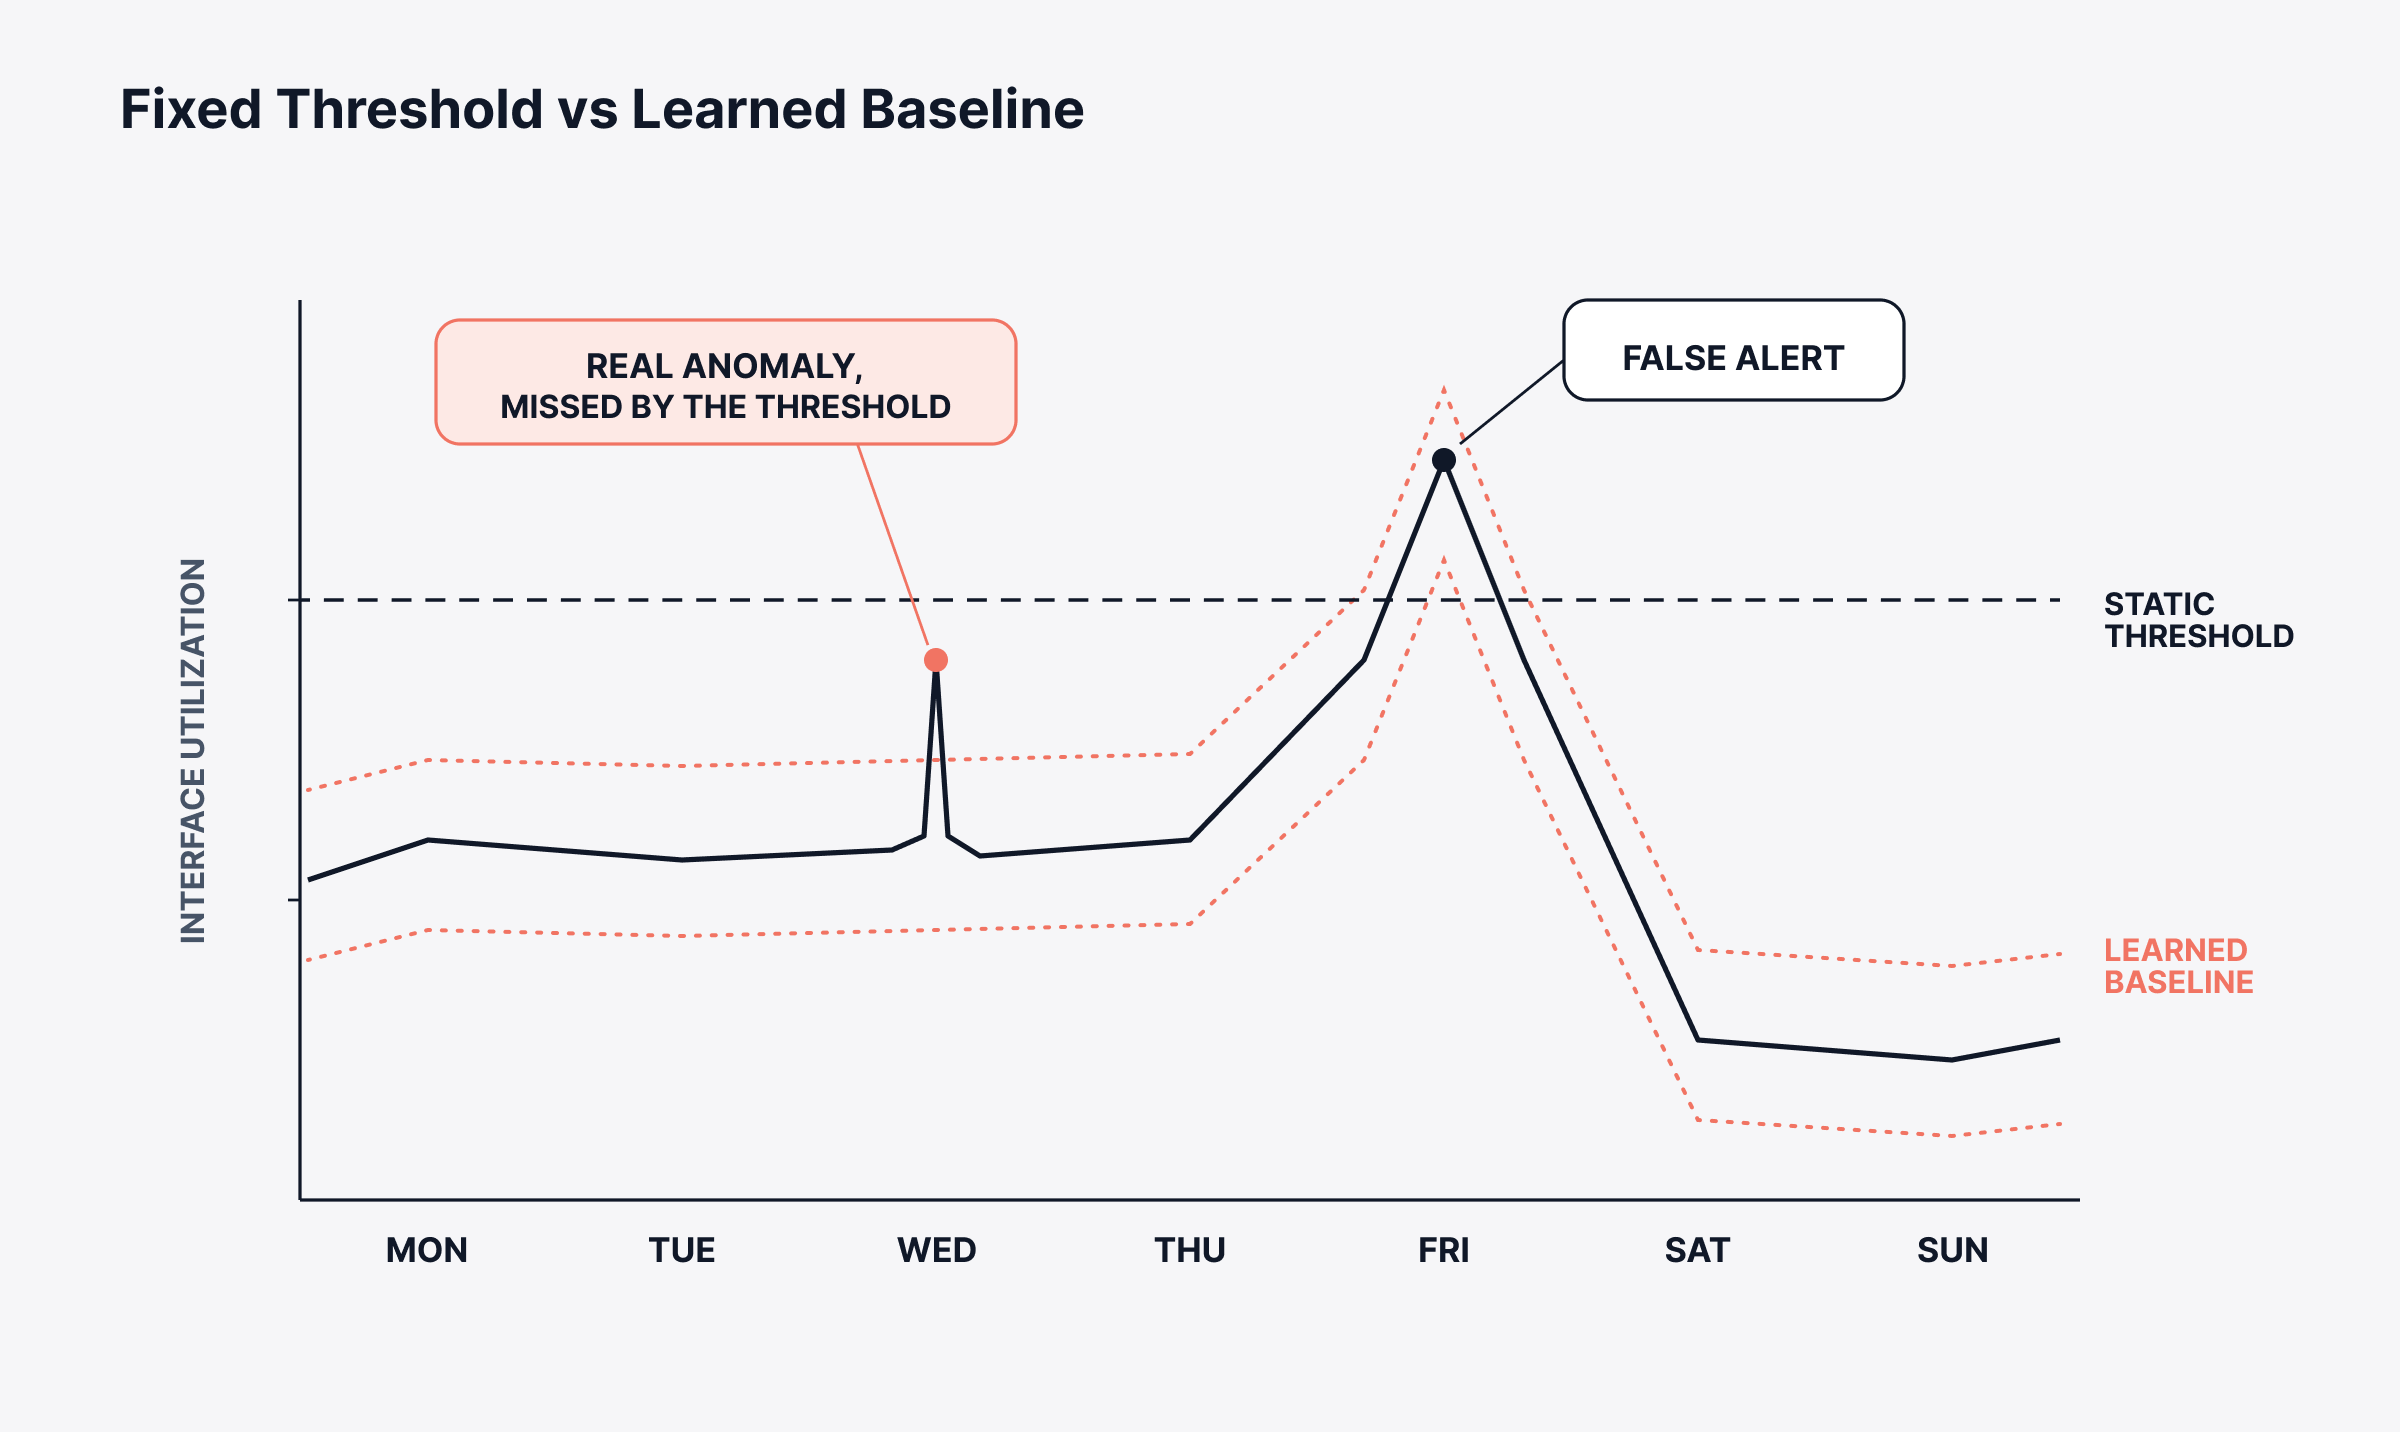
Interface utilization, latency, packet loss, and CPU load arrive as continuous numbers. Static thresholds handle those numbers badly. An interface at 80% means one thing overnight and something else at month end.
Machine learning replaces the fixed number with a dynamic baseline. The model learns the normal shape of each metric by hour and by day, then alerts on departures from it. Platforms that do this apply network performance insight across latency, jitter, packet loss, and interface utilization.
The gain shows up as fewer alerts nobody acts on. Take a link that runs hot every Friday afternoon. Once the model knows Friday looks like that, it stops paging anyone. We see the biggest drop on links with a weekly rhythm.
A week of real traffic shows the difference best.
2. Flow Records
NetFlow, sFlow, jFlow, and IPFIX records describe who talked to whom, for how long, and how much data moved. A busy network produces far more of them than anyone can read, which is the problem intelligent traffic analysis exists to solve.
AI groups flows into patterns and surfaces the ones that break the pattern. A host starts talking to a country it has never reached. A backup job doubles in volume overnight. Both surface without anyone writing a rule for them.
3. Logs
Syslog from switches, routers, and firewalls carries the most detail. It also arrives in the largest volume, because a single device can emit thousands of lines an hour.
Log intelligence clusters repeated messages into patterns, then flags the rare ones. Clustering also compresses an incident timeline. A human reads twenty distinct events instead of nine thousand lines.
4. Configuration Changes
Most network outages trace back to something that changed. According to the Uptime Institute Annual Outage Analysis 2025, outages from IT and networking issues rose to 23% of impactful outages in 2024. The report puts that down to growing complexity, change management problems, and misconfigurations.
AI applied to configuration data compares each captured config against its own history and against a policy baseline. Network configuration drift detection flags a change the moment it happens, instead of during the next audit.
5. SNMP Traps and Events
Traps fire between polling intervals and carry the events polling would miss. Traps also arrive in floods, because one physical failure lights up every device downstream of it.
Trap handling depends on correlation. The model groups SNMP traps that share a cause. You get one incident with a probable root, instead of forty notifications describing the same broken link.
Which Alerts Should Stay on Fixed Thresholds?
Not every alert belongs to a model. Platforms that ship both kinds make you choose. We split ours into basic policies, which fire on a fixed number, and AI and ML policies, which learn a baseline first.
The choice has nothing to do with which one is more advanced. It comes down to whether the condition has a rhythm.
Keep a fixed threshold when | Move to an AI or ML policy when |
The condition is binary, such as a link down or a device that stopped responding | The metric moves on a daily or weekly rhythm |
A contract sets the number, such as an SLA target or a licence ceiling | Normal varies by device, by site, or by hour |
Crossing the line is always an incident | You care about the shape of a change more than its absolute value |
The alert must behave identically every single time | Static numbers have already produced alert fatigue |
Teams that move everything to machine learning usually regret it. A link that goes down is an incident at any threshold. A model that hedges on it costs you minutes.
The reverse mistake is far more common. Interface utilization, latency, and request volume all rise and fall on a schedule. A fixed number on any of them generates noise forever.
What Is Networking for AI Infrastructure?
Networking for AI is a hardware and fabric design problem. It shows up when you train or serve large models on GPU clusters, and it barely touches teams who do neither.
Model training splits work across many GPUs that must stay synchronized. Every training step ends with the GPUs exchanging results. The slowest link sets the pace for the whole cluster. A GPU waiting on the network still costs you money.
That constraint pushes data center networking in a few specific directions:
Very high bandwidth per port: east-west traffic inside the cluster dwarfs anything heading to users.
Predictable low latency: consistency matters more than peak speed, because the slowest exchange gates the step.
Lossless behavior: retransmissions stall the whole job, so these fabrics are engineered to avoid dropping packets at all.
Dedicated fabrics: the GPU network is usually kept separate from storage and management traffic.
Two terms cluster around this work. AI data center networking describes the fabric itself. AI-native networking is a vendor phrase for platforms built with AI in the architecture instead of bolted on later, and it belongs mostly to the operations side.
Enterprise teams running applications, offices, and branches rarely meet these constraints. Renting GPU capacity from a cloud provider hands the fabric to somebody else entirely. We find most readers who land on this topic came for the operations pillar and only needed to rule this one out.
What Are the Benefits of AI Networking?
The benefits below belong to the operations pillar, which is the one most teams ever buy.
Benefit | What changes in practice |
Fewer meaningless alerts | Dynamic baselines stop paging on normal peaks, and correlation collapses alert storms into single incidents. |
Faster root cause | Dependency mapping points at the failing device instead of listing everything affected by it. |
Earlier warning | Forecasting flags a link heading for saturation weeks before it gets there. |
Fewer change-related outages | Config drift gets caught at the moment of change, not at the next audit. |
Less manual triage | Runbooks handle the diagnostic steps a person would run first anyway. |
Capacity planning on evidence | Trend models replace the spreadsheet estimate nobody trusts. |
The benefits above share one theme. AI does not make the network faster on its own. It cuts the time between something breaking and somebody knowing why.
Forecasting is the one most teams underrate. Capacity planning optimization turns the annual argument into an evidence exercise, forecasting network saturation weeks ahead.
Where AI Networking Applies Across Your Network
The same techniques land differently depending on which part of the network you point them at.
Network type | What AI is asked to do there |
Campus and Wi-Fi | Catch roaming failures, interference, and client-side problems that access points never report as faults. |
WAN and SD-WAN | Steer paths on live latency and loss, and flag carrier degradation before users start calling. |
Data center | Correlate east-west traffic with host and application metrics so one failure resolves to one root cause. |
Edge and remote sites | Run detection locally where bandwidth back to a central collector is limited or expensive. |
Edge deserves a note of its own. Shipping every packet header from a remote site to a central platform gets costly fast, and some sites cannot spare the uplink at all.
Pushing detection closer to the device solves that bandwidth problem. The model runs at the site, and only anomalies and summaries travel back. Teams running retail branches, factory floors, and remote facilities hit this constraint first.
Campus networks tend to produce the fastest visible win, because Wi-Fi complaints are subjective and hard to reproduce.
A model comparing a complaining client against thousands of normal sessions settles those arguments quickly. This is where Wi-Fi monitoring earns its keep.
Where AI Networking Still Falls Short
AI networking is oversold as a category, and four limits come up in every deployment we have watched.
1. It Cannot Fix Data You Do Not Collect
A model reasons over signals it receives. Devices outside monitoring stay invisible. So does a branch with no flow export, or a firewall nobody forwards logs from. The AI will not mention the gap.
2. It Needs Time Before It Is Useful
Dynamic baselines learn from history. A platform deployed on Monday has no idea what Tuesday should look like. Most need weeks of traffic before their alerting beats a well-tuned threshold, so we tell teams to expect a quiet first month.
3. It Struggles With Genuinely New Events
Anomaly detection finds departures from normal. A first-of-its-kind failure looks like an anomaly. So does a brand new application, and so does a network redesign. The first weeks after any big change get noisy.
4. It Cannot Own the Decision
Automated remediation works on narrow, well-understood faults such as restarting a service or rolling back a config. Nobody sensible lets a model re-architect routing during an outage. The judgment stays with your engineers.
Why Your Polling Interval Caps What AI Can Detect
A model can only find patterns in data it actually received. Your collection interval sets a hard ceiling on what any amount of machine learning can detect, and almost nothing written about AI networking mentions it.
The math is simple: a device polled every five minutes yields twelve samples an hour. A congestion event lasting forty seconds either falls inside one of those samples or vanishes completely, and averaging buries it even when it lands.
Collection method | What a model can see | What it never sees |
SNMP polling, 5 minutes | Sustained utilization, trends, capacity growth | Microbursts, brief packet loss, short spikes |
SNMP polling, 1 minute | Shorter congestion and most user-visible slowdowns | Sub-minute bursts on high-speed links |
Agent-based, 1 second | Process and resource spikes as they happen | Anything on a device with no agent installed |
Flow records | Who generated the traffic and where it went | Anything below the exporter's sampling rate |
Traps, event-driven | Failures the poller would never sample | Anything the device does not raise a trap for |
Two things follow from that table. Faster collection changes what anomaly detection is capable of finding, not merely how fast it reports.
We report latency with sub-millisecond precision and poll agent metrics as often as every second, which brings short events inside the model's reach.
Traps also deserve more weight than they usually get. They are the only signal that fires between polls, which is why an event-driven feed belongs alongside polling instead of underneath it.
Before you judge a platform on model quality, check the interval it collects at. The collection interval caps everything downstream of it.
Four Things Your Network Data Needs First
We keep seeing the same gap between a good demo and a disappointing rollout, and it comes down to data quality. Four things need to be true first.
Coverage: every device that can take down a service is monitored, including the ones added last quarter.
Consistent naming: the same device carries the same identity across metrics, logs, flows, and your CMDB.
Synchronized clocks: correlation depends on timestamps, and drift between devices breaks the sequence an incident timeline is built from.
Enough history: baselines need weeks of normal traffic, so retention matters as much as collection.
None of this groundwork is glamorous, and all of it costs less than the platform you bolt on afterwards. Teams already running AI and ML in network performance monitoring tend to have solved these four first, which is why their results look better.
How to Start With AI Networking
Begin with one signal and one outcome. Prove the model earns its place before you widen the scope.
We usually point teams at alert noise first, because the baseline is easy to measure. Count the alerts your team received last month, then count how many led to action. Anomaly-based alerting either moves that ratio or it does not.
Configuration drift makes a good second step. Change detection and compliance checks give a clear pass or fail. The value shows up within weeks.
Platform choice follows from those two steps. We built Motadata as a unified observability and ITSM platform, so metrics, flows, logs, traps, and configs land in one place. The correlation engine reads across all of them.
Network observability covers WAN, LAN, SD-WAN, wireless, and hybrid footprints. AI and ML policies handle anomaly detection, dynamic baselines, root cause analysis, and capacity planning.
Configuration work sits alongside monitoring. Motadata handles configuration backup, change detection, and compliance assessment. The standards covered include CIS, HIPAA, and SOX. Runbooks can remediate what the checks find.
Whatever you pick, the cost of getting it wrong is measurable. According to the Uptime Institute Annual Outage Analysis 2026, 57% of organizations said their most recent major outage cost more than $100,000. One in five put the figure above $1 million.
Decide Which Pillar You Are Buying
AI networking only gets confusing when the two pillars get discussed as one thing. Naming your problem makes every vendor conversation shorter. Half the vendors are selling the answer to the other problem.
AI only reads the network you give it. Poor coverage and inconsistent naming produce confident, useless output. No model fixes poor data for you. Budget for the data work before the platform.
Start with the signals you already collect and fix the gaps that exercise exposes. Then let AI-powered observability earn its scope one outcome at a time. A network that explains its own failures is worth far more than one that only reports them.
FAQs
Is AI networking the same as AIOps?
AI networking and AIOps overlap. AIOps applies AI across IT operations broadly, while AI for networking is the part aimed at network signals such as flows, traps, and configs. A platform doing one usually does some of the other.
What is AI-native networking?
It is a vendor term for platforms designed with AI in the architecture from the start, instead of AI features added to an older product. Treat it as positioning and judge the capabilities underneath it.
Does AI networking replace network engineers?
No, it removes triage work such as reading alert floods and correlating events by hand. Design, capacity decisions, and outage judgment calls stay with engineers. The tooling just makes those calls better informed.
How much data does AI networking need before it works?
Most dynamic baselines need several weeks of traffic to learn normal patterns. Include at least one full business cycle. Retention settings matter here, since a model cannot learn from data you already deleted.
Can AI networking work on a small network?
Yes, and anomaly detection helps wherever alert volume outpaces the team reading it. Alert overload happens on modest networks too. The gain scales with noise, not device count.
Author
Ramya Shah
Technical Writer
Ramya Shah is a technical content writer with a computer engineering background and roots in automotive journalism. He covers IT Service Management, observability, IT operations, and AI-driven automation. An early adopter of AI-assisted writing workflows, he turns complex IT processes into clear, engaging content optimized for search and answer engines (AEO), lifting content output and organic visibility.