PostgreSQL Cluster Monitoring to Keep Replicas in Sync and Failover Ready
If your primary PostgreSQL server failed in the next five minutes, could a standby take over with every recent transaction intact? Many monitoring setups cannot answer that with confidence. They confirm that each server is up, yet the replication linking those servers gets far less attention.
In this article, a PostgreSQL cluster means a primary server that handles writes and one or more standbys that copy those writes from it. The copying runs on the write-ahead log (WAL), which is PostgreSQL's record of every change. PostgreSQL cluster monitoring keeps an eye on each node and on that replication link, mainly to answer one question: would a failover lose data?
Getting that answer takes more than running a standard database monitoring checklist against one node after another. In this blog, you will see:
What an unmonitored cluster puts at risk for the business
Why standalone checks miss the failures clusters are prone to
Which metrics to read on the primary and on each standby
The problems that cause the most damage, and the practices that catch them early
How Motadata monitors clustered and standalone PostgreSQL in the same workflows
Why Does PostgreSQL Cluster Monitoring Matter to the Business?
PostgreSQL cluster monitoring tells the business whether its spending on availability and data protection is still paying off. Most organizations judge a cluster against two recovery targets:
Recovery point objective (RPO): How much recent data the business can afford to lose, which replication lag controls directly
Recovery time objective (RTO): How quickly service must return after a failure, which depends on a healthy standby being ready to promote
Take an order platform that promises to lose no more than one minute of transactions. If its standby falls 90 seconds behind, that promise is already broken. Every server can report being healthy while that happens.
Standby servers are never free to run. Their compute and storage get billed every month, and a standby that can't take over gives the business nothing back for that spend. Targets like five nines uptime quietly assume every standby is ready.
Why Does Standalone PostgreSQL Monitoring Fall Short for Clusters?
Standalone PostgreSQL monitoring falls short for clusters because it looks at one server at a time. Cluster failures, though, usually start between servers. Your primary may show healthy connections and quick queries even as a standby drifts hours behind it.
Standard PostgreSQL monitoring covers connections, queries, cache and disk on one instance. Once you run a postgres cluster, new questions appear that a single-instance view was never built to answer:
Role: Which node is the primary at this moment, and whether that has changed since the last check
Replication state: Whether every expected standby is connected and receiving changes
Data freshness: How far each standby trails the primary, in bytes and in seconds
Log retention: Whether replication slots are holding WAL files back and filling the primary's disk
Failover readiness: Whether a healthy standby is still available to take over
None of these questions can be settled by looking at a single server, because each one involves at least two. That makes them a job for cluster-wide observability. In practice, PostgreSQL replication monitoring needs to know how the nodes are arranged, compare one against another and keep track of the primary when it changes hands; the next section turns each question into metrics.
What Are the Key PostgreSQL Cluster Metrics to Monitor?
The key PostgreSQL cluster metrics cover three areas: node status and cluster health, replication and lag, and the performance of each node. Each group tells you something the other two cannot. It also matters where you look, because the primary reports some of these signals and the standbys report the rest.
1. PostgreSQL Cluster Health and Node Status
Cluster health starts with role. Find out whether each node is the primary, a standby or simply down. A server that's up can still be a problem, since a node in the wrong role keeps answering connections while it causes harm.
Run the checks below before looking at any performance figure. Until you know which node is which, those figures are hard to interpret.
Signal | Where to read it | What it tells you |
Node reachability | Every node | Whether the server accepts connections |
Current role | Every node, via pg_is_in_recovery() | True means standby, false means primary |
Count of primaries | Compared across all nodes | One is healthy; two means split brain |
Connected standbys | Primary, via pg_stat_replication | Whether every expected standby is streaming |
Timeline ID | Every node | A new timeline means a standby was promoted |
Give the count of primaries its own alert. If two nodes take writes at once, you have split brain: two copies of business data drifting apart, and a slow, risky job of merging them later. Role changes reach applications too, and service dependency mapping points out which services rely on the node that moved.
Look at both ends of every replication link, since the primary sees some things and the standby sees others. The topology below spells out which signal each node reports.
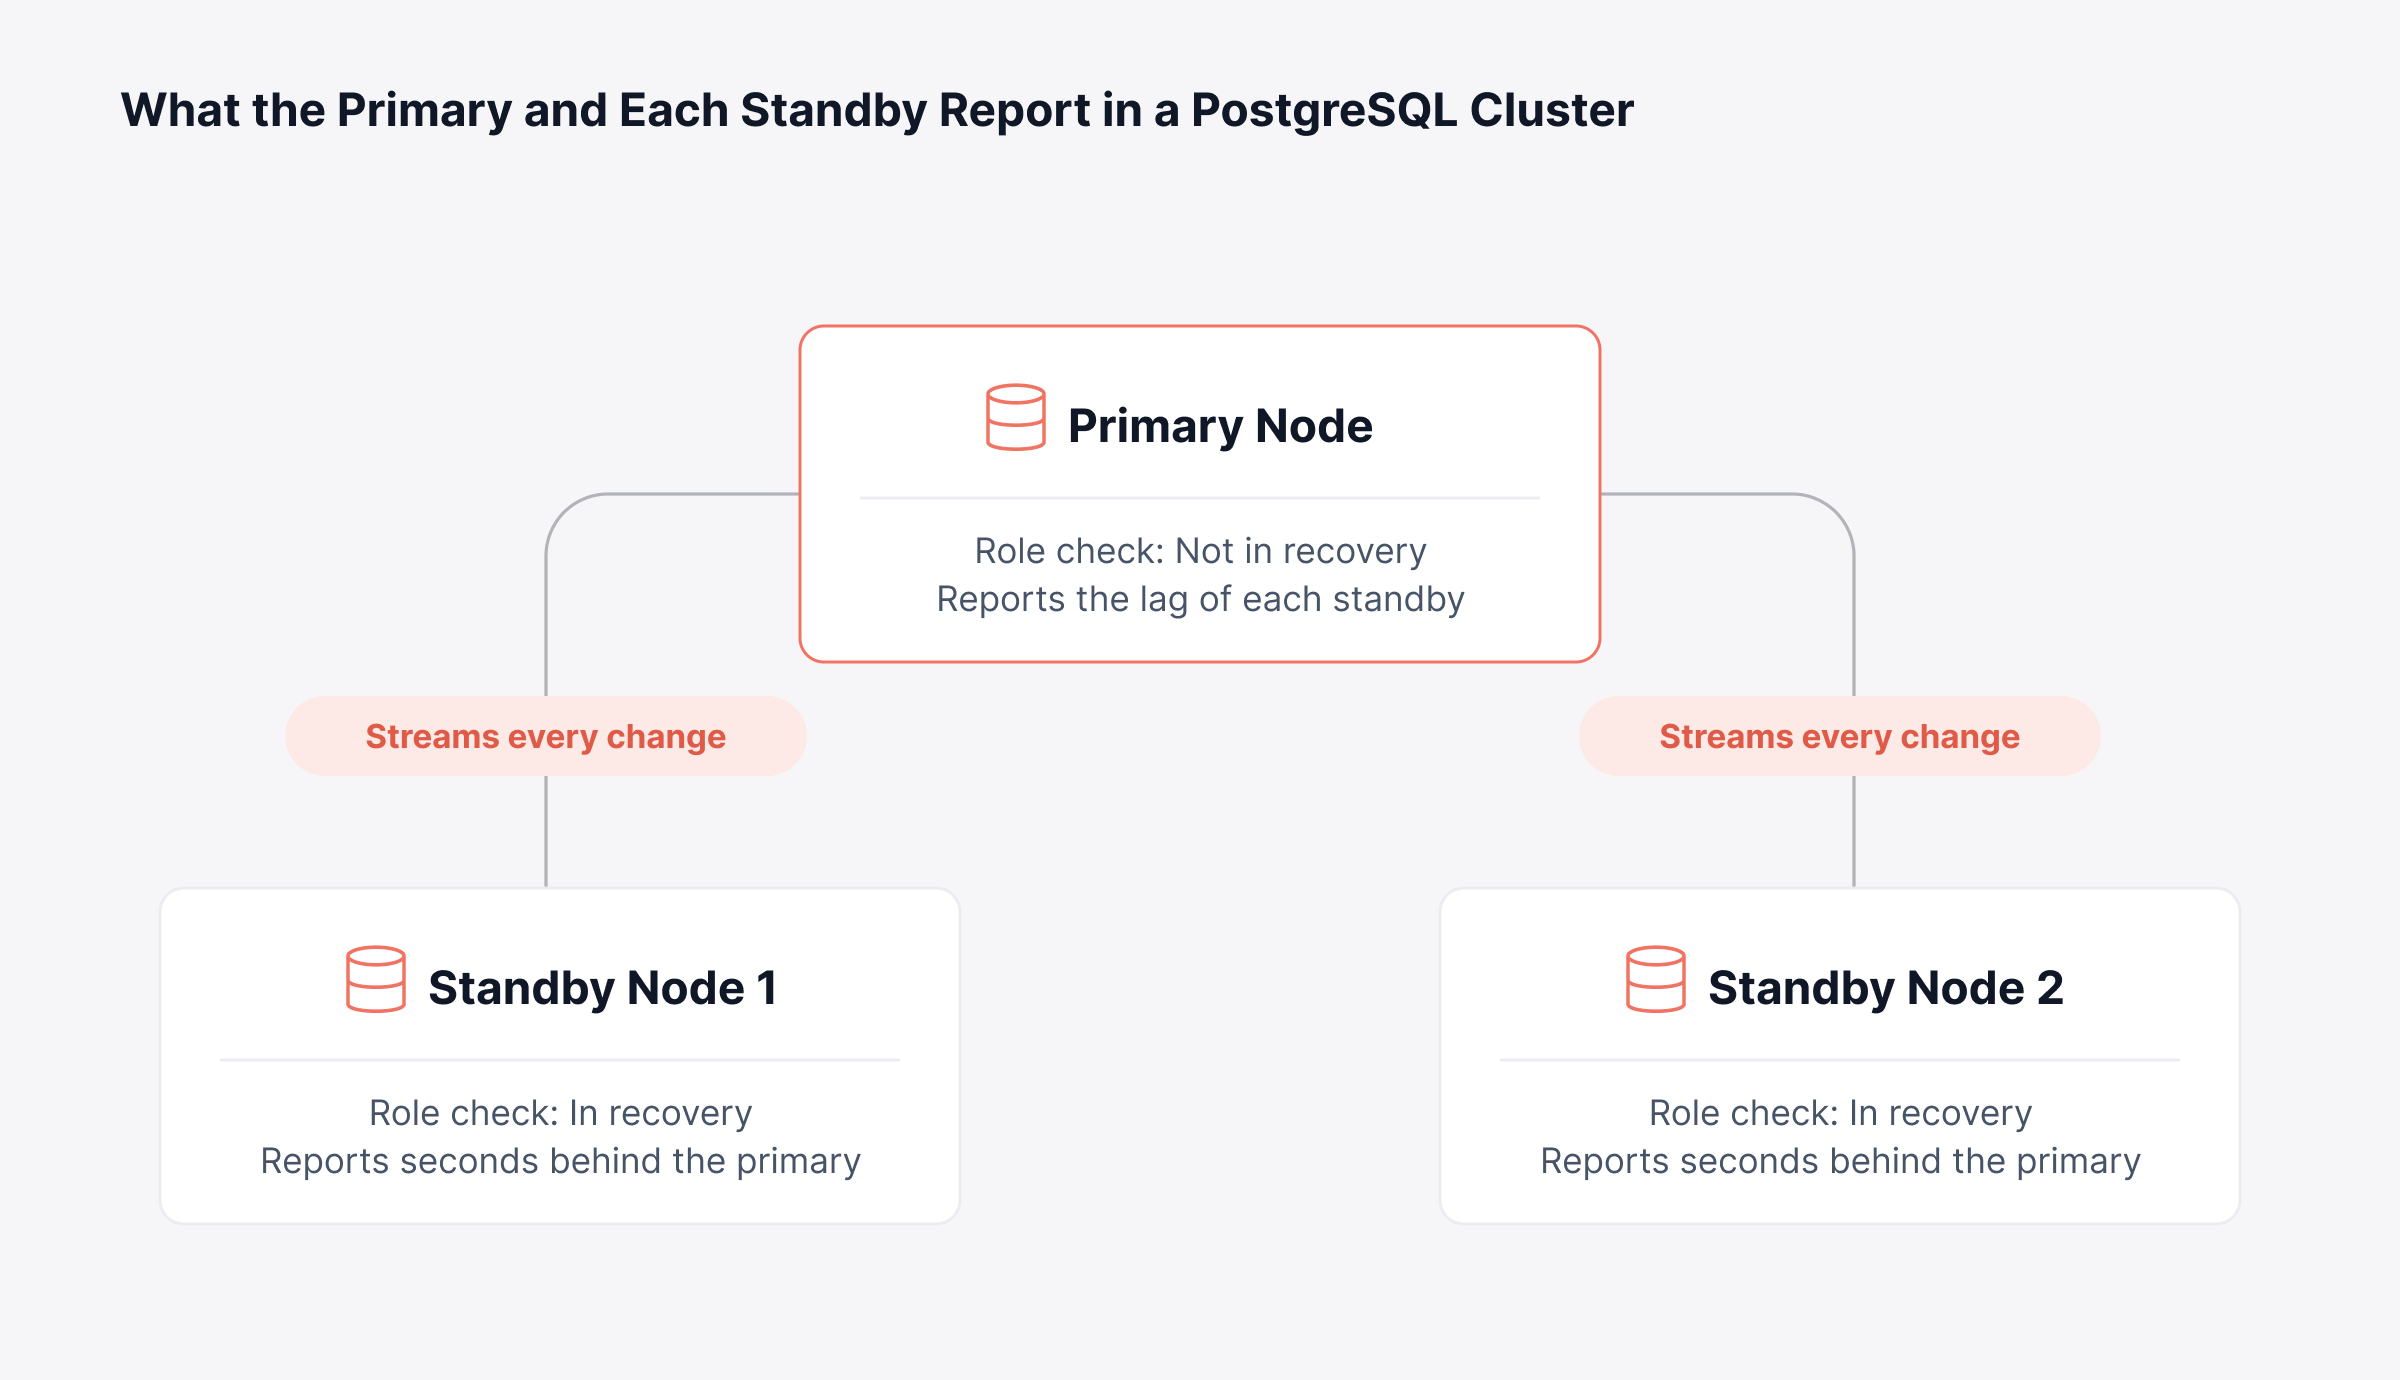
Once every node's role is confirmed, the next question is how current each standby is.
2. PostgreSQL Replication Status and Replication Lag
Replication lag is the delay between a change committing on the primary and that change appearing on a standby, and it is the clearest measure of how much data a failover could lose. It behaves much like consumer lag in streaming platforms, which our Kafka monitoring guide covers. Postgres replication lag can be read in two units.
Byte lag: The gap between the primary's current WAL position and the position each standby has replayed, calculated on the primary with pg_wal_lsn_diff
Time lag: How long ago the last replayed transaction committed, read on the standby with pg_last_xact_replay_timestamp
Time lag has one known trap. On a quiet primary with no new writes, the last replayed transaction simply ages, and time lag keeps rising even though the standby has nothing left to apply. Pair it with byte lag before you alert on PostgreSQL replication lag.
On the primary, the pg_stat_replication view gives you three lag columns per standby. Every one of them starts its count when the primary saves the change. So a later column always includes whatever the earlier ones measured:
Write lag: Time until the standby has received the change and handed it to its operating system
Flush lag: Time until the standby has also saved it to durable storage
Replay lag: Time until the standby has applied the change and made it visible to queries
Line the three numbers up and the slow stage usually stands out. The timeline below lays out network, disk and apply delay as separate segments that add up from left to right.
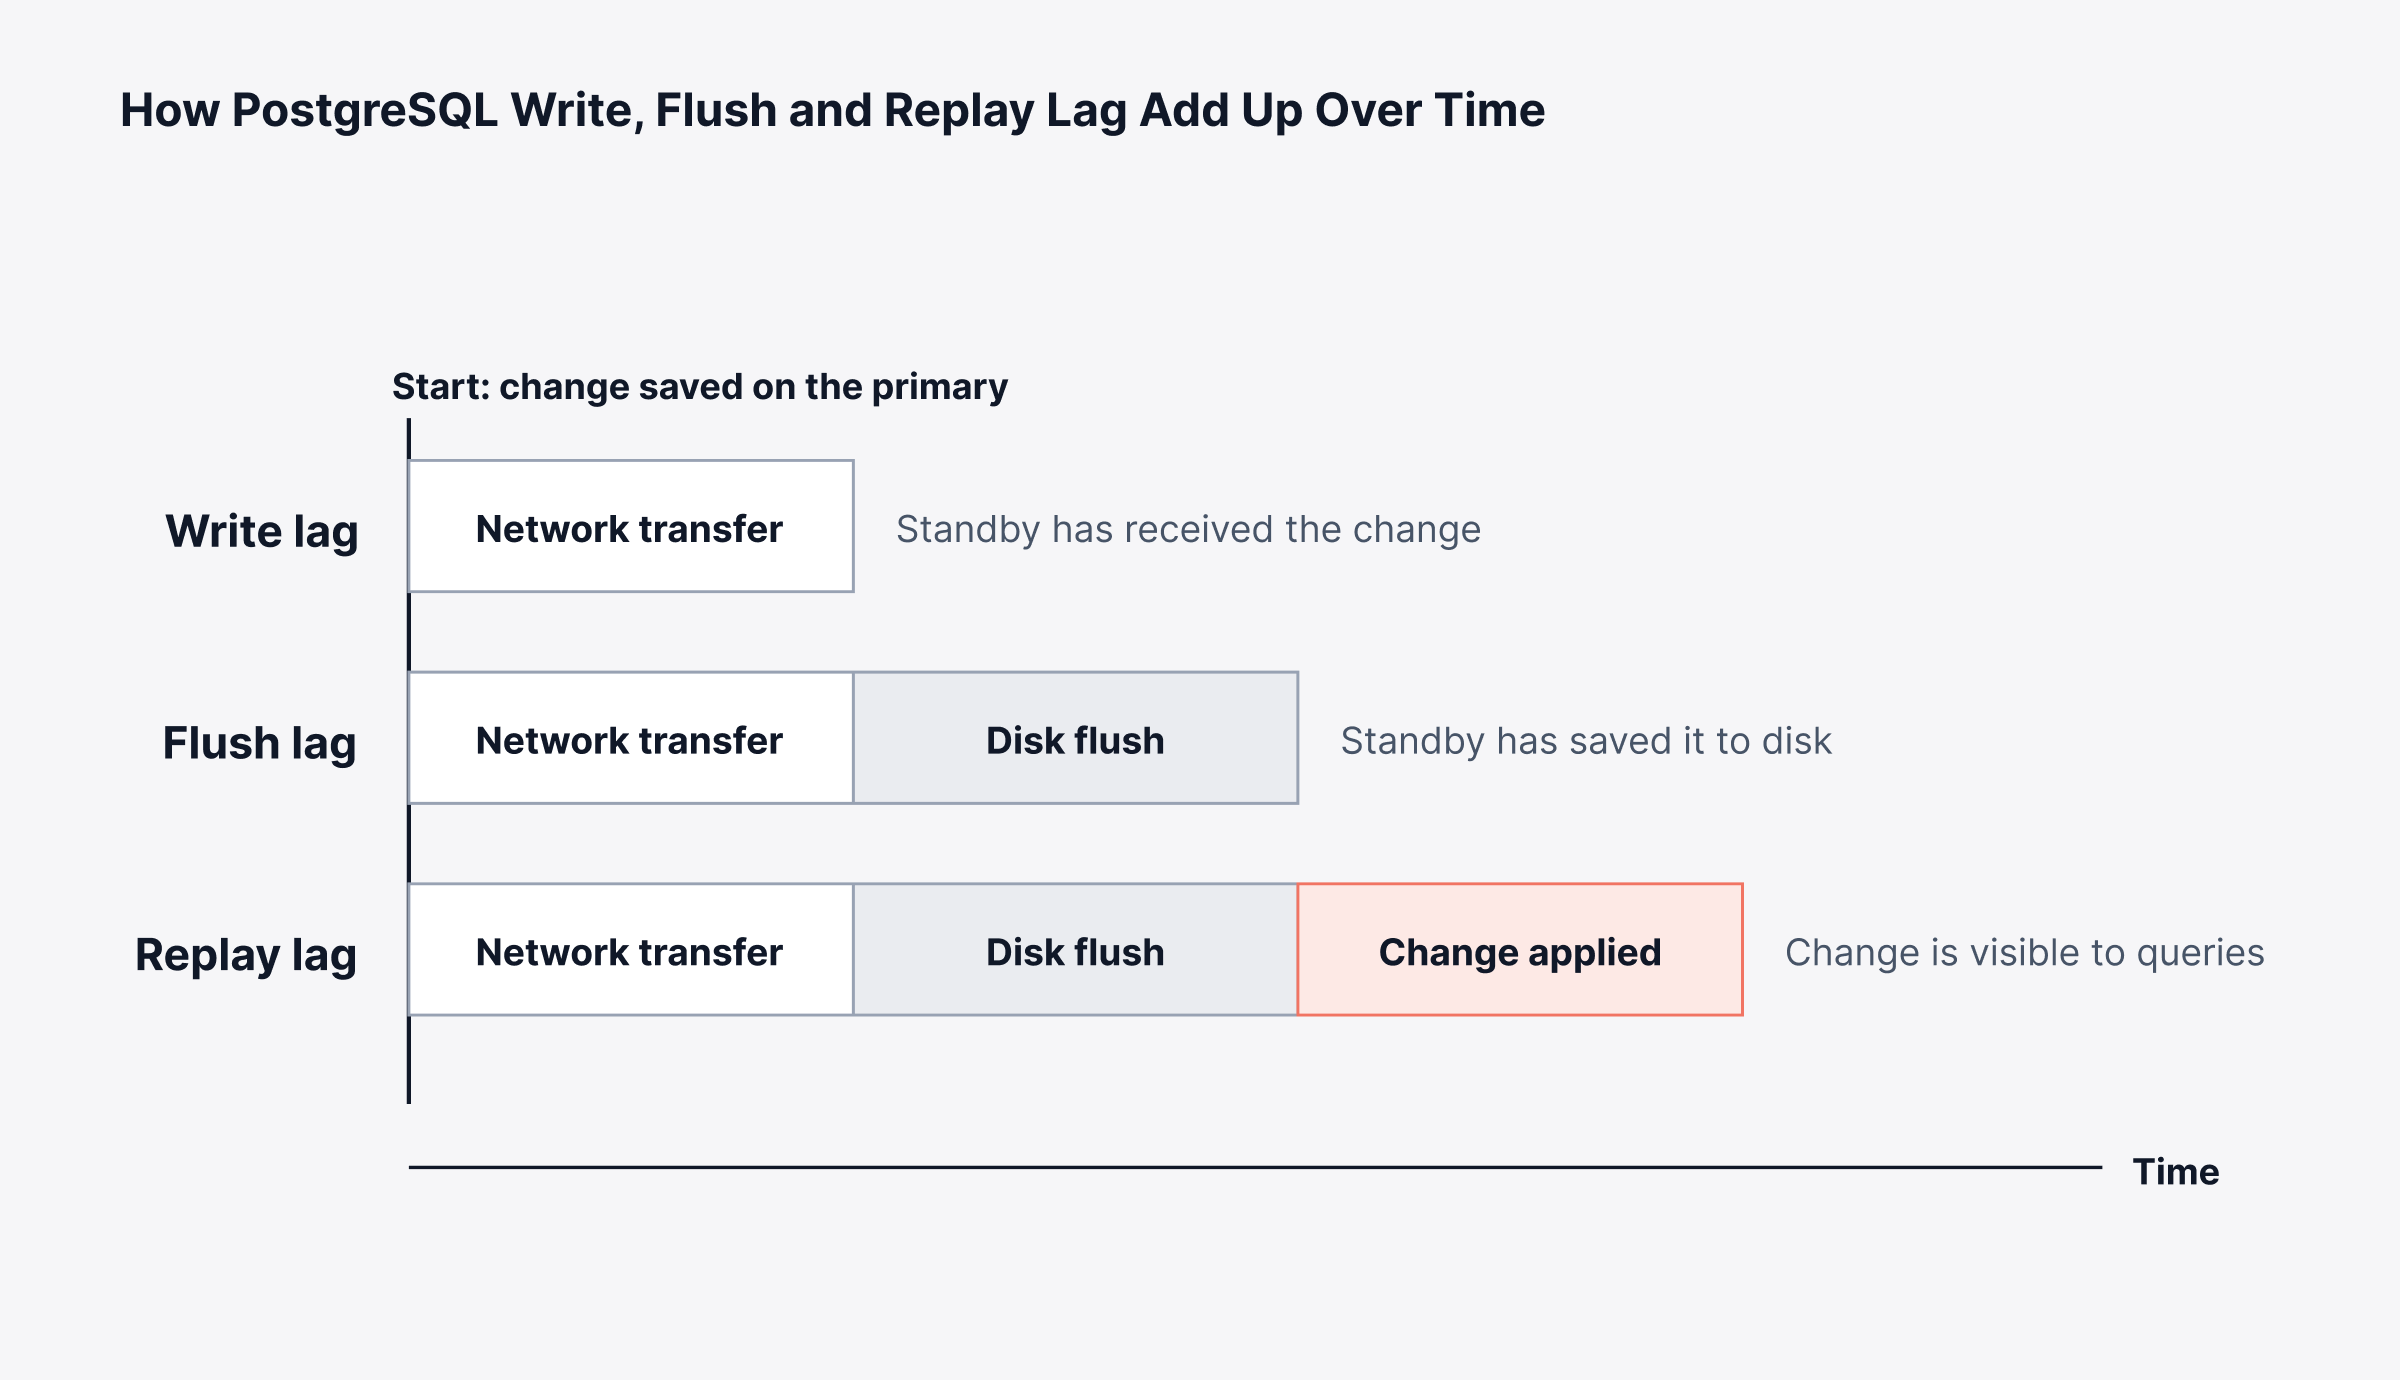
When write lag is high from the start, check the network and the primary's sending load first. A large step from flush lag to replay lag usually points to a standby that is busy applying changes or held up by long-running queries of its own. Two other columns in that view are worth adding to your checks:
State: Streaming is normal, while catchup means the standby is still working through a backlog
Sync state: Whether commits on the primary wait for that standby to confirm before they complete
PostgreSQL replication slots come next. With a slot in place, the primary keeps WAL until its standby confirms receipt, which is helpful right up until that standby disappears and the files start to pile up. To see what's going on, query pg_replication_slots for each slot's active status; PostgreSQL 13 and later also show how much retained log is at risk.
Here is a familiar case: a reporting standby goes offline for maintenance, but its slot stays. The primary holds on to every log file that standby has missed. If the maintenance runs long, the disk fills up and writes stop altogether, all because of a server that wasn't even in use.
3. Node-Level Performance on the Primary and Standbys
Node-level checks are about load on each server: CPU, memory, disk and connections. Check the primary and the standbys one by one, using the same approach on virtual machines, bare metal and Kubernetes alike. Standbys often handle read traffic, which means one of them can struggle or run low on memory even when the primary seems healthy.
Connections: Active and waiting sessions against the configured limit, since reaching it blocks new application requests
Queries: Slow and long-running statements, usually tracked with the pg_stat_statements extension
Locks: Blocked sessions and deadlocks, a database concurrency problem that stalls transactions
Replication conflicts: Standby queries cancelled because they clashed with incoming changes, which reporting users experience as failed reports
Disk: Free space, growth of the WAL directory and I/O wait
CPU and memory: Processor load, memory pressure and buffer cache hit ratio
When a standby is busy with slow queries, replay waits, and the result shows up in your lag numbers. Reading query performance monitoring data next to lag keeps the cause and the symptom in one view.
What Are the Most Common PostgreSQL Cluster Problems?
The most common PostgreSQL cluster problems are lag that grows unnoticed, standbys that drop out of sync, failovers no one is told about and nodes that fail quietly. Configuration and change play a large part in many of them.
That pattern shows up in outage research too. Uptime Institute's 2025 outage analysis found IT and networking issues behind 23% of impactful outages in 2024, with the increase tied mostly to change management and misconfiguration. Below, each cluster problem is matched with what happens technically and what it costs the business.
Problem | What happens | Business impact |
Growing replication lag | Write bursts or slow standbys let lag build | More recent data at risk if failover happens |
Standby out of sync | Needed log files are gone, so the standby must be rebuilt | Hours without a spare while a full copy is restored |
Unannounced failover | An automatic PostgreSQL failover promotes a standby with no alert | The cluster runs with no spare until someone notices |
Silent node failure | A standby goes down while the primary keeps serving | Protection is missing exactly when it is needed |
Slot-driven disk exhaustion | An abandoned slot keeps log files until the disk fills | Writes stop and applications fail |
Stalled commits | Synchronous replication loses its confirming standby | Transactions wait, and users see the application hang |
Look at one node at a time and none of these failures seems urgent. That is exactly why they stretch detection time. Catching them early is the job of the practices that follow.
What Are the PostgreSQL Cluster Monitoring Best Practices?
PostgreSQL cluster monitoring best practices focus on tracking roles, setting lag alerts against recovery targets and verifying every failover. Five practices handle most PostgreSQL high availability monitoring needs, and they apply no matter which tool runs postgres high availability for you.
1. Track Every PostgreSQL Node by Its Current Role
A failover changes which server is primary. Base your checks and alerts on each node's current role so they move with it.
Check every node's role on each polling cycle
Alert when the count of primaries is anything other than one
Confirm the expected number of standbys is connected to the primary
2. Set Replication Lag Thresholds from Your Recovery Point Objective
Start from the RPO the business has signed off on and work backwards to a lag threshold. That way, every lag alert signals a recovery target in danger.
Alert on byte lag and time lag together to avoid false alarms on an idle primary
Watch the trend as well as the current value, since steady growth signals a standby that cannot keep up
Use anomaly detection to flag lag that departs from its normal pattern
3. Monitor Replication Slots and Write-Ahead Log Disk Usage
A slot issue can grow for days with no visible symptom, then halt writes when the disk fills. Slots deserve dedicated checks for that reason.
Alert on any inactive slot that keeps retaining WAL
Track free space on the primary's WAL volume against a clear threshold
Set max_slot_wal_keep_size, the cap on how much log a slot can hold, so one stalled standby cannot fill the disk
4. Verify Cluster Health After Every PostgreSQL Failover
When a failover finishes, the work is not over yet. Check that the new layout of primary and standbys is healthy before anyone closes the incident.
Alert on role changes and new timelines as soon as they appear, and confirm the promotion in the database logs
Rebuild or reattach the old primary so the cluster regains a spare standby
During planned failover tests, apply time-bound alert suppression so expected alerts do not mask unexpected ones
5. Correlate Database Signals with Host and Application Data
Plenty of lag problems begin outside PostgreSQL. Storage running at its limit is one common trigger. Congestion on the network between nodes, or one application sending a big batch of writes at once, can cause the same thing.
Read lag next to disk I/O and network metrics on the same timeline
Connect slow application transactions to the queries behind them through application-database correlation
Reuse the same alerting approach for other engines, including Oracle database monitoring and the options in our MySQL monitoring tools guide
Doing all five every day gets much easier once clustered and standalone databases share a single workflow.
How Does Motadata Monitor PostgreSQL Clusters?
Motadata ObserveOps now monitors PostgreSQL clusters right next to standalone PostgreSQL instances. Cluster health, replication status and node-level metrics all appear in the platform's standard database monitoring workflows.
That shared workflow matters day to day. Database administrators get one place to watch both kinds of deployment. Clusters don't call for an extra tool or a process of their own.
Cluster health: The state of each PostgreSQL cluster as a whole
Replication status: Replication between the primary and its standbys
Node-level metrics: Performance data for every node in the cluster
Shared workflows: Clustered and standalone PostgreSQL handled through the same database monitoring workflows
The PostgreSQL integration already covers individual instances, with KPIs for connections, sessions, locks and queries. Buffer and cache hit ratios, checkpoints and deadlocks are part of that list as well. ObserveOps is a unified observability platform, so these database figures can be read next to your server, network and application data.
Move From Node-by-Node Checks to Cluster-Wide PostgreSQL Observability With Motadata ObserveOps
Trouble in a PostgreSQL cluster usually begins where one server hands off to another. One standby slips further and further behind. A leftover slot might fill a disk while a failover leaves no spare, and single-node checks seldom surface either problem until recovery is underway.
One limit is worth stating plainly: monitoring by itself does not make a cluster resilient. That job belongs to a tested failover manager, sensible replication settings and a practiced recovery plan, and monitoring's part is to keep checking that they still hold. Motadata ObserveOps now brings that confirmation to PostgreSQL clusters, monitoring them alongside standalone instances in the same database workflows so you can:
See the health of each cluster as a whole
Follow replication status between the primary and its standbys
Track node-level metrics for every server in the cluster
Our latest ObserveOps release notes cover this addition in detail, along with other capabilities shipped in the same update, such as Apache Kafka monitoring.
FAQs
What is a PostgreSQL cluster?
In PostgreSQL's own terminology, a database cluster is the set of databases managed by one server instance. In high availability discussions, a postgres cluster usually means a primary server plus one or more standby servers that replicate its changes, which is the meaning used in this article.
How do I check replication lag in PostgreSQL?
On the primary, query the pg_stat_replication view, which reports write, flush and replay lag for each connected standby. On a standby, compare the current time with the timestamp of the last replayed transaction, and check byte lag as well so an idle primary does not trigger false alarms.
How can I monitor queries in PostgreSQL?
Enable the pg_stat_statements extension to collect execution counts and timings for each statement, and use pg_stat_activity to see what is running at any moment. In a cluster, monitor the standbys too, because long queries there can delay replay and add to replication lag.
What are some good PostgreSQL monitoring tools?
PostgreSQL monitoring tools range from open-source stacks built on exporters and dashboards to commercial observability platforms. When comparing them, check how each one handles clusters, replication and node-level visibility. Motadata ObserveOps, for instance, monitors PostgreSQL clusters and standalone instances in the same database monitoring workflows.
What causes replication lag in PostgreSQL?
Replication lag usually comes from heavy write bursts on the primary, limited network bandwidth between nodes, slow disks on a standby or long-running queries that delay replay. Reading replication status next to node-level metrics, which Motadata ObserveOps brings into one workflow, helps narrow down which cause applies.
Author
Poonam Lalani
Content Strategist
Poonam Lalani is a B2B content strategist and writer with a background in computer engineering and experience across enterprise technology domains, including AI, cloud, DevOps, data engineering, and IT operations. She specializes in creating research-driven content that simplifies complex ideas and supports product education, thought leadership, and business growth.