10 Best MySQL Monitoring Tools Compared for 2026
Your monitoring console probably covers the switches, the hosts, the VMs and the application traces. The database tier is the gap. It tends to live in a separate tab. Somebody opens that tab once the incident bridge has already started.
That gap got more expensive this year. On 21 April 2026, Oracle moved MySQL 8.0 to Sustaining Support. The version most production estates still run no longer gets new fixes.
Good MySQL monitoring tools close the gap. They show you the slow query, the lock it waits on, and the host it runs on. All of it sits in one view.
Picking one is the hard part. The market splits into database-only specialists and full-stack platforms, and the two price very differently.
In this blog, you will see:
A side-by-side comparison of 10 tools, covering scope, deployment, query-level depth and starting price
What MySQL's built-in tools already give you, and where they stop
Eight things worth checking before you sign anything
A short decision guide that picks by situation instead of by feature count
By the end, you will know which tool fits your estate and roughly what it costs to run.
What Is MySQL Monitoring?
MySQL monitoring is the practice of tracking the health, performance and availability of a MySQL database server. It covers server metrics such as connections, throughput and InnoDB buffer pool usage.
It also covers query-level detail, meaning which statements run slowly, what they wait on, and how they use indexes. MySQL performance monitoring is the narrower slice of that work, focused on speed rather than uptime.
The point is to catch a problem before your users do. You want to see a replica drift 40 seconds behind, or a buffer pool hit ratio slide.
You also want to catch deadlocks climbing while queries per second stay flat. All three show up long before anyone files a ticket, and all three get missed when nothing is watching.
What MySQL's Built-In Tools Cover
MySQL ships with monitoring built in, and it is better than most teams expect. The Performance Schema records server events and query execution, and the sys schema turns that raw data into readable views.
The slow query log captures every statement that runs past a threshold you set. The mysqladmin command line tool reports status counters, and MySQL Workbench adds a Performance Dashboard covering live server, network and InnoDB metrics.
Turn these on whatever else you buy. They are also where a lot of teams stop, and I still see production databases running on nothing more than the Performance Schema and a cron job.
Built-in tools show the current state of one server. They keep very little history and raise no alerts.
Nothing links the slow query to the failing checkout page it caused. Administration tools such as phpMyAdmin have the same ceiling, and filling that gap is what a monitoring platform is for.
How We Evaluated These Tools
We compared these tools the way an IT team shortlists them, not by counting features. Seven things decided the ranking.
Query-level depth: Does it surface slow queries, execution plans and wait events, or only server counters?
Index and schema insight: Does it flag unused or missing indexes, where a lot of MySQL latency hides?
Collection method: Agentless, agent-based, or both, and what that costs you on a busy database server.
Managed MySQL support: Whether it works on Amazon RDS, Aurora and Cloud SQL, where host access is restricted.
Correlation with the wider stack: Whether a slow query lands on the same timeline as the host, the network path and the application call.
Deployment flexibility: SaaS, self-hosted, on-premises or air-gapped.
Pricing transparency and support status: A published price is worth a lot, and so is a product that is still supported.
That last point matters more this year than usual. MySQL Enterprise Monitor still shows up in plenty of buying guides. It reached end of life on 1 January 2025, and Oracle's own notice tells users to move to Oracle Enterprise Manager for MySQL.
The 10 Best MySQL Monitoring Tools Compared
Here is how the 10 tools line up on the things that usually decide a shortlist.
Tool | Best For | Scope | Deployment | Query-Level Analysis | Starting Price |
Motadata ObserveOps | MySQL alongside the rest of your stack | Full-stack | On-prem, cloud, hybrid | Yes | Quote-based |
Datadog Database Monitoring | Cloud-native teams already on Datadog | Full-stack | SaaS | Yes | $70 per database host/month |
Percona Monitoring and Management | Deep open-source MySQL analytics | Database-only | Self-hosted (Linux) | Yes | Free, open source |
SolarWinds Database Performance Analyzer | Wait-time root cause across mixed estates | Database-only | Self-hosted, cloud | Yes | Quote-based, per instance |
New Relic | Linking MySQL latency to application traces | Full-stack | SaaS | Yes | Free to 100 GB/month, then $0.40/GB |
Prometheus + Grafana + mysqld_exporter | Kubernetes teams that prefer to build | Database-only | Self-hosted | No | Free, open source |
Zabbix | One open-source monitor for everything | Full-stack | Self-hosted | No | Free, open source |
Oracle Enterprise Manager for MySQL | MySQL Enterprise Edition shops | Database-only | Self-hosted | Yes | Requires MySQL Enterprise Edition |
Dynatrace | Automated root cause across app and database | Full-stack | SaaS, managed | Yes | $58/month per 8 GiB host |
ManageEngine Applications Manager | Mid-market teams on a tight budget | Full-stack | Self-hosted, cloud | Partial | $395/year for 10 monitors |
Each tool below gets a closer look, covering what it does well, where it falls short, and what it costs.
Detailed Overview of the 10 Best MySQL Monitoring Tools in 2026
1. Motadata ObserveOps
Best for: IT and NOC teams that need real MySQL depth without running a separate database tool
Rating: 4.7/5 on G2
Pricing: Quote-based
ObserveOps is a unified observability platform, and MySQL is one of the tiers it monitors natively. It collects roughly 180 MySQL KPIs out of the box. You get InnoDB internals and query behaviour, not a handful of surface counters.
The question we get asked most is about index intelligence. ObserveOps reports unused indexes with their size on disk. It flags missing indexes and tracks index fetch rates. Most platforms here leave that job to a specialist tool.
You can collect agentlessly over JDBC, which needs port 3306 open and a set of credentials. You can also use MotaAgent for faster polling.
MotaAgent samples as often as every second, and it buffers locally when the link drops. A flaky WAN does not leave a hole in your data.
Star ratings only tell you so much, so it helps to hear from a team that runs the platform every day. This G2 review from one of our customers shows what that consolidation looks like in practice:
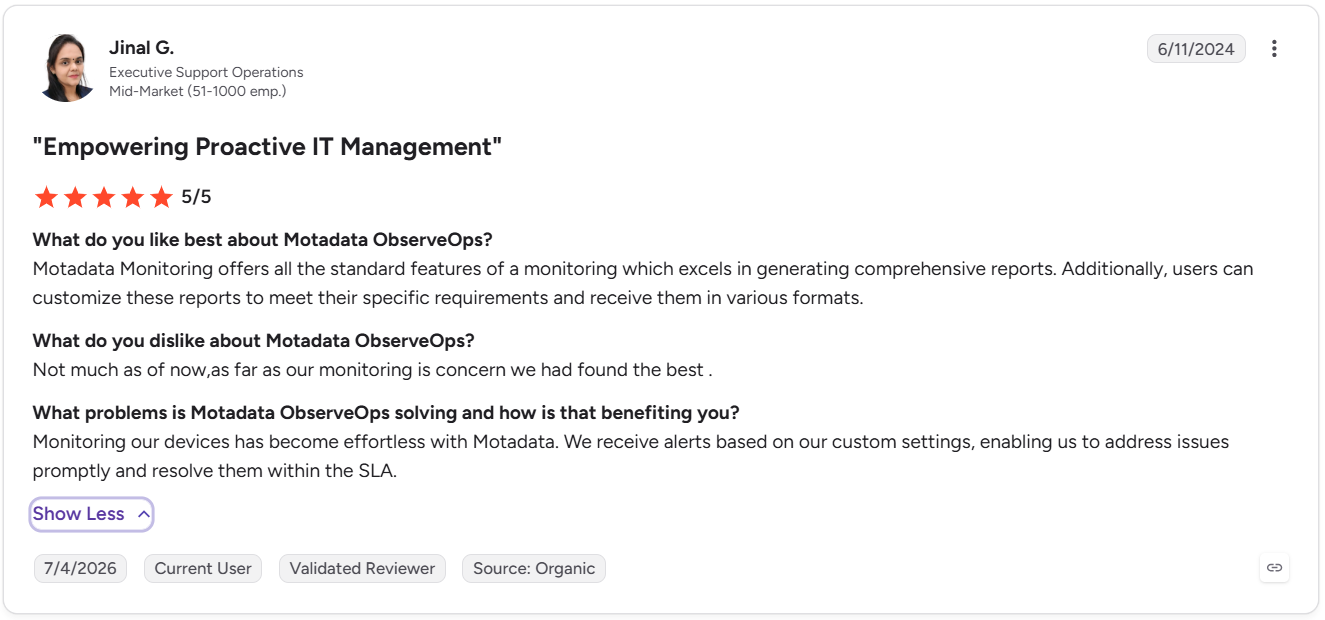
You can read more ObserveOps reviews on G2.
Pros
- One console holds the database, the host, the network path and the application trace
- The agentless option leaves no footprint on the database server
- On-premises and air-gapped deployments are supported, which rules a lot of SaaS tools out
- Index-level findings that usually need a second, database-specific product
Cons
- There is no public price list, so budgeting starts with a sales conversation
- The review footprint is smaller than Datadog's or Dynatrace's, so there is less peer feedback to read
- A full observability platform is more than you need if MySQL is the only thing you watch
2. Datadog Database Monitoring
Best for: Cloud-native teams already standardised on Datadog
Rating: 4.4/5 on G2
Pricing: From $70 per database host per month, billed annually
Datadog Database Monitoring reads MySQL's own generated metrics and turns them into normalised query trends. It captures explain plans automatically. When a query degrades, you can see the plan that ran at the time, not the plan that runs now.
Collection runs through the standard Datadog Agent. If that agent is already on your servers, there is nothing extra to install. Coverage extends to on-premises, self-managed and cloud-hosted MySQL.
One detail catches buyers out at quote stage. Database Monitoring cannot be bought on its own. Their pricing FAQ states you must already be an Infrastructure Monitoring customer, so the real entry cost is two products.
Pros
- Strong query-level visibility with very little setup on an existing Datadog install
- Explain plan history makes a regression much easier to prove
- The wider platform ties database data to APM and infrastructure
Cons
- It cannot be purchased standalone, so you buy Infrastructure Monitoring as well
- Each database host comes with an allotment of 200 normalised queries, which busy estates pass quickly
- SaaS only, which rules it out for air-gapped or residency-restricted environments
3. Percona Monitoring and Management (PMM)
Best for: Teams that want the deepest open-source MySQL analytics and can staff it
Rating: 4.5/5 on G2
Pricing: Free and open source
PMM is the strongest free option here, and it holds its own against paid tools. Query Analytics gives you real-time and historical query data. The InnoDB and buffer pool dashboards go deeper than most commercial dashboards.
It also ships built-in advisors that check your setup against Percona's own best practice. A security tool watches failed logins and privilege changes, and Grafana dashboards come included.
PMM's real cost shows up in staff time. It runs on Linux only, and you own the install, the scaling and the upgrades. We have watched teams adopt it happily, then quietly stop patching it eight months later.
Pros
- Genuine query-level depth at no licence cost
- Purpose-built for MySQL, MariaDB and Percona Server, so the defaults are sensible
- Active community and frequent releases
Cons
- Linux only, which is a hard stop for Windows shops
- You carry the install, scaling, upgrade and on-call burden yourself
- Database-focused, so it says nothing about the network path or the application making the call
- No vendor SLA unless you buy Percona support separately
4. SolarWinds Database Performance Analyzer (DPA)
Best for: DBAs doing wait-time root cause across a mixed database estate
Rating: 4.5/5 on G2
Pricing: Quote-based, licensed per monitored database instance, with a 14-day trial
DPA is built around wait-time analysis, which is a different question from the one most tools ask. It does not just chart that a query is slow. It works out what that query spent its time waiting on.
That makes it the fastest route we have found from a complaint to a cause. DPA adds tuning advisors, machine learning anomaly detection and SolarWinds AI for query tuning and storage forecasting.
The design is agentless. SolarWinds states it uses under 1% of resources on the monitored instance. It covers SQL Server, Azure SQL, Oracle, MySQL, MariaDB and PostgreSQL, so mixed environments stay in one tool.
Pros
- Wait analysis explains cause, not just symptom, which shortens triage
- The agentless design keeps the database server clean
- One tool covers a mixed database estate
Cons
- No published price, so budgeting needs a sales conversation
- It sits apart from SolarWinds infrastructure monitoring, so a full picture takes more than one product
- Database-only scope, with no application or network context
5. New Relic
Best for: Teams whose first question is whether the app or the database is slow
Rating: 4.4/5 on G2
Pricing: The free tier includes 100 GB of ingest per month, then $0.40 per GB. Core users cost $49 per month. Full Platform Pro users cost $349 per month on an annual commitment.
New Relic's MySQL integration collects inventory and metrics from the database. It lands them next to your application traces. When a page slows down, you can follow the transaction into the SQL statement behind it.
That is genuinely useful, and it is why New Relic keeps appearing on these lists. Distributed tracing plus real user monitoring gives you the full path from browser to query.
Pricing is where IT Ops teams get caught. New Relic charges per user as well as per GB. In an operations team, plenty of people need to read a dashboard without ever building one, and we see that line surprise buyers more than the ingest charge does.
Pros
- The best tool here for connecting a database symptom to an application cause
- Generous free tier at 100 GB of monthly ingest
- One platform covers app, host and database
Cons
- Per-user pricing punishes wide operations teams
- MySQL arrives as an integration rather than a purpose-built database product, so the depth is shallower
- Ingest-based billing makes monthly cost hard to forecast
6. Prometheus + Grafana + mysqld_exporter
Best for: Kubernetes and platform teams that would rather build than buy
Rating: 4.5/5 on G2
Pricing: Free and open source
Prometheus, Grafana and the mysqld_exporter are three separate components doing one job. The exporter scrapes MySQL server status. Prometheus stores it as time-series data, and Grafana draws the dashboards.
It is the default in Kubernetes shops for good reason. PromQL handles arbitrary queries and aggregations. One exporter instance can cover several MySQL targets, and Alertmanager takes care of routing and escalation.
Be clear about what you are getting. This stack gives you server counters. Query analysis sits outside what it does. There is no slow query breakdown and no execution plan unless you add another tool to produce them.
Pros
- No licence cost and no vendor lock-in
- Endlessly customisable, and native to Kubernetes
- A huge community, so most problems are already solved somewhere
Cons
- Three components to install, secure, scale and upgrade before you see a chart
- No query-level analysis out of the box, so slow queries stay invisible
- No tracing, so a slow query never links back to the request behind it
- Long-term retention needs a fourth component
7. Zabbix
Best for: Infrastructure teams that want one open-source monitor for everything
Rating: 4.3/5 on G2
Pricing: Free and open source
Zabbix earns its place because MySQL is one of many things it watches. The official MySQL template covers connections, throughput, buffer pool usage and replication.
It drops into an existing Zabbix install in minutes. We meet it most often in environments that grew past 500 devices.
Low-level discovery picks up new databases and tables on its own, which saves real time as the environment grows.
Alerting is properly configurable. Escalation chains and dependencies stop one outage from firing 40 notifications.
Zabbix stops short on depth. The template is metric-level, so you see that queries are slow without seeing which query, or why.
Pros
- One free tool covers servers, network devices and databases
- The alerting logic is better than most paid tools offer
- Scales comfortably to thousands of monitored hosts
Cons
- Metric-level only, with no slow query analysis or execution plans
- Meaningful setup and tuning before it earns its keep
- The interface feels dated next to SaaS platforms
8. Oracle Enterprise Manager for MySQL
Best for: MySQL Enterprise Edition shops staying inside Oracle's stack
Rating: 4.3/5 on G2
Pricing: Requires a MySQL Enterprise Edition subscription
Start with the part most buying guides get wrong. MySQL Enterprise Monitor is dead. Oracle's own end-of-life notice reads: "MySQL Enterprise Monitor is End of Life (EOL) as of January 1, 2025. Users are encouraged to use Oracle Enterprise Manager for MySQL."
Enterprise Manager is the replacement. It auto-discovers MySQL databases on managed hosts. A Query Analyzer finds slow-running statements. Enterprise Manager can also automate fixes, such as restarting MySQL when it stops.
For an Oracle shop, the appeal is one support contract covering both database and monitoring. For everyone else, the entry price is a MySQL Enterprise Edition subscription. That puts it out of reach of community-edition estates.
Pros
- Database and monitoring come from the same vendor, on one support contract
- Deep integration with the wider Oracle management stack
- The Query Analyzer works through the Performance Schema with little configuration
Cons
- It requires MySQL Enterprise Edition, so community-edition users are excluded
- Oracle licensing takes work to model accurately
- Teams that invested in Enterprise Monitor face a migration they did not plan for
9. Dynatrace
Best for: Large enterprises that want automated root cause across application and database
Rating: 4.5/5 on G2
Pricing: Full-Stack Monitoring costs $58 per month for an 8 GiB host, billed at $0.01 per memory-GiB-hour. Infrastructure Monitoring costs $29 per month per host.
Dynatrace needs less configuration than anything else here. OneAgent finds MySQL instances on its own. Davis AI builds a baseline from historical data and flags deviations, with no thresholds for you to set.
Tracing runs end to end, down to individual SQL statements. You see how the application actually uses the database, which is rarely how the team assumes it does.
Watch the pricing model on database hosts. Full-Stack Monitoring is priced on host memory, and database servers are memory-heavy by design. At the published rate, a 64 GiB MySQL host costs eight times what an 8 GiB web server costs.
Pros
- The least manual configuration of any platform here
- Automated root cause analysis that usually points at the right component
- Strong analyst and peer review scores
Cons
- Memory-based pricing gets expensive on exactly the servers you most want to watch
- Database monitoring is a by-product of full-stack observability, not a purpose-built product
- The licensing model takes real effort to forecast
10. ManageEngine Applications Manager
Best for: Mid-market IT teams that want database and application monitoring cheaply
Rating: 4.7/5 on G2
Pricing: The free edition monitors up to 5 apps or servers. Professional Edition starts at $395 per year for 10 monitors. Enterprise Edition starts at $3,995 per year for 100 monitors.
Applications Manager has the lowest entry price of any paid tool here. The free edition covers five monitors. For $395 a year you get ten, which is enough for a small estate.
MySQL coverage includes connection time, request and connection statistics, table lock statistics and query hit ratio. Forecasting reports project resource growth, which helps in capacity planning conversations.
Model the monitor-count licensing before you buy. Every database, host and service consumes a monitor. A modest environment reaches 50 monitors faster than most teams expect.
Pros
- A very low entry price, with a usable free tier
- Covers applications and infrastructure as well as databases
- Quick to deploy on a small setup
Cons
- Monitor-count licensing adds up quickly as the estate grows
- The interface feels dated
- Metric-level MySQL coverage, without deep query or index analysis
What Should You Look for in a MySQL Monitoring Tool?
Eight things separate a MySQL server monitoring tool that answers your questions from one that only draws charts. Work through them in this order.
1. Query-Level Visibility, Not Just Server Metrics
Server counters tell you the database is busy. Query-level data tells you which statement is responsible. Look for slow query capture, execution plans and wait events. That is the line between a monitoring tool and a dashboard.
2. Index and Schema Intelligence
A lot of MySQL latency traces back to indexes. They go missing, sit unused, or bloat on disk. Unused indexes are the first thing we check on a slow database. Tools that report unused index size and flag missing indexes save hours of manual work. Very few vendors advertise the capability, so put it on your question list.
3. Replication and Cluster Health
If you run replicas, treat replica lag and replication thread state as first-class metrics. You want failover visibility too. A replica silently 90 seconds behind still passes a basic availability check, and it serves stale data the whole time. It is the metric we see missed most often.
4. Collection Method
Agentless collection keeps the database server clean, and it is often the only option on managed MySQL. Agent-based collection polls faster and keeps recording when the network drops. We support both, because the environment should decide this, not the tool.
5. Coverage of Managed MySQL
Amazon RDS, Aurora and Cloud SQL restrict host access. That breaks collectors built around an agent on the database server. If any part of your estate is managed, confirm support explicitly rather than assuming it.
6. Correlation With the Rest of the Stack
A slow query is rarely a database monitoring problem on its own. Ask whether the tool puts the query, the host metrics, the network path and the application call on one timeline. In our experience, that is what shortens an incident bridge.
7. Deployment and Data Residency
SaaS-only tools are off the table for air-gapped environments, and for some regulated industries too. No feature list changes that. If you need on-premises or high availability across sites, filter on that first and compare features second.
8. The Licensing Unit
Tools bill per host, per instance, per user, or per GB ingested. The unit decides whether your bill grows with your database count or with your team size. Those two rarely grow at the same rate.
Which MySQL Monitoring Tool Is Right for Your Team?
The right tool follows from your situation more than from any feature comparison. Find your row.
Situation | Start With | Why |
MySQL is one tier among many you already monitor | A full-stack platform with real database depth | You skip a second console, and the query lands on the same timeline as the host and network |
You have DBAs and no budget | An open-source database-native tool | Query analytics without a licence, if you can staff the operation |
You need on-premises or air-gapped deployment | A self-hosted platform with high availability options | SaaS-only tools drop out before features matter |
Your team is already deep in one observability vendor | That vendor's database module | Correlation comes free, though check the standalone purchase rules |
You run MySQL Enterprise Edition | Vendor-native tooling | Database and monitoring stay on one support contract |
You need to get from a slowness report to the responsible query fast | A tool built around wait-time analysis | Wait analysis explains cause rather than symptom |
Your estate is small and the budget is fixed | A monitor-count product with a free tier | You can prove value on five monitors before spending anything |
Most teams match more than one row. Start with the constraint you cannot change, which is usually deployment or budget.
Pick the Best MySQL Monitoring Tool for Your Business
There is no single winner here, and any list claiming one is selling something. Percona PMM gives you the deepest free query analytics, if you can run it. Datadog and Dynatrace are strong once you have committed to their platforms and can absorb the pricing model.
Our position is simpler. For most IT teams, MySQL is not a specialism. It is one tier among forty. A standalone MySQL database monitoring tool means a second console, a second alerting policy and a second thing to patch, all to watch one slice of an estate you already monitor everywhere else.
That gap is what we built ObserveOps MySQL monitoring for. You get InnoDB internals, slow queries, lock waits and index findings at specialist depth.
They sit on the same platform that already holds your servers, network devices, logs and traces. It runs on-premises, in the cloud, or across both.
Whatever you choose, decide on scope first and features second. The tool that fits your estate beats the tool with the longer feature list.
FAQs
What is the difference between MySQL monitoring and MySQL performance tuning?
Monitoring tells you what is happening, such as slow queries, lock waits and replication lag. Tuning is what you change afterwards, including indexes, configuration and query structure. Some tools do both. Most only monitor.
Are free and open-source MySQL monitoring tools enough for production?
Often, yes. Percona PMM, Zabbix and a Prometheus stack all run production workloads today. You trade licence cost for staff time, because you own the install, the scaling, the upgrades and the on-call rota.
Can MySQL monitoring tools work with Amazon RDS, Aurora and Cloud SQL?
Most can, within limits. Managed services block host-level access, so agent-based collectors often cannot run at all. Check whether the tool supports agentless collection, or reads the provider's own metrics, before you buy.
Which MySQL monitoring tools run on Windows?
Zabbix, ManageEngine Applications Manager, SolarWinds DPA and ObserveOps all run on Windows. Percona PMM is Linux only. For a mixed Windows and Linux estate, an agentless collector is usually the safer choice.
Is Motadata ObserveOps better than Datadog for MySQL monitoring?
It depends on scope. Datadog is strong if you are SaaS-native and already on their platform. We fit better when MySQL sits inside a wider on-premises or hybrid estate, and you want one console instead of stacked subscriptions.
Author
Ramya Shah
Technical Writer
Ramya Shah is a technical content writer with a computer engineering background and roots in automotive journalism. He covers IT Service Management, observability, IT operations, and AI-driven automation. An early adopter of AI-assisted writing workflows, he turns complex IT processes into clear, engaging content optimized for search and answer engines (AEO), lifting content output and organic visibility.