Apache Kafka Monitoring Metrics That Keep Business Data Flowing on Time
What do you do when every server check on your Kafka cluster passes, yet orders and payments are arriving minutes late? That's the situation Apache Kafka monitoring is built for. It watches messages as they move through brokers, partitions and consumer groups, so a delay can be traced to the exact place it began.
In many organizations, Kafka now carries the events that orders, payments and analytics depend on. If one broker struggles or a partition slows, every service reading from it slows down too. Consumer groups can drift far behind as well, and often nobody notices until a report comes out wrong.
Kafka needs its own metrics, read as part of a wider observability practice that includes application performance monitoring. In this blog, you will see how Kafka is put together and which of its metrics deserve an alert. We'll then look at healthy values and at agent-based versus agentless collection, before ending with what Motadata ObserveOps now does for Apache Kafka.
How Does Apache Kafka Work?
Apache Kafka works as a distributed, append-only log. Producers keep adding events to the end, and the brokers hold onto them for the retention period you set. Consumers can then read at their own speed, even hours after the events arrived.
You'll run into these terms in every metric section that follows, so here they are in one place.
Producers: Applications that publish events, such as orders, clicks or log lines
Brokers: Servers that store events and serve them to readers, grouped into a cluster
Topics and partitions: A topic is a named stream of events, split into partitions so several brokers can share the load
Offsets: The position number of each event within a partition
Replicas: Copies of each partition kept on other brokers, so data survives a broker failure
Consumer groups: Sets of consumers that divide a topic's partitions between them and record how far they have read
Controllers: Nodes that manage cluster metadata, handled by KRaft in recent Kafka releases
That is why so many event-driven applications and telemetry pipelines use Kafka to move data around. The trouble is that Kafka's problems tend to stay hidden. A lagging replica or a stuck partition won't show up on any check that only watches the server.
Why Should You Monitor Apache Kafka?
Monitoring Apache Kafka matters because the failures you care about start inside the cluster. Host-level checks have no visibility into it.
Message delays: A slow broker or overloaded partition delays every service that depends on it, even when no component is down
Data loss risk: Replicas that drop out of sync leave partitions with fewer copies, so one more broker failure can lose acknowledged data
Consumers falling behind: Lag builds quietly, and stale data reaches fraud checks, inventory counts or analytics without raising any error
Broker failures: A lost broker forces leadership changes and rebalancing, which can stall producers and consumers across the cluster
An uptime check won't catch any of these, but your customers and your revenue reports will. Watching the flow of data itself brings down MTTD, the stretch between a fault starting and someone spotting it.
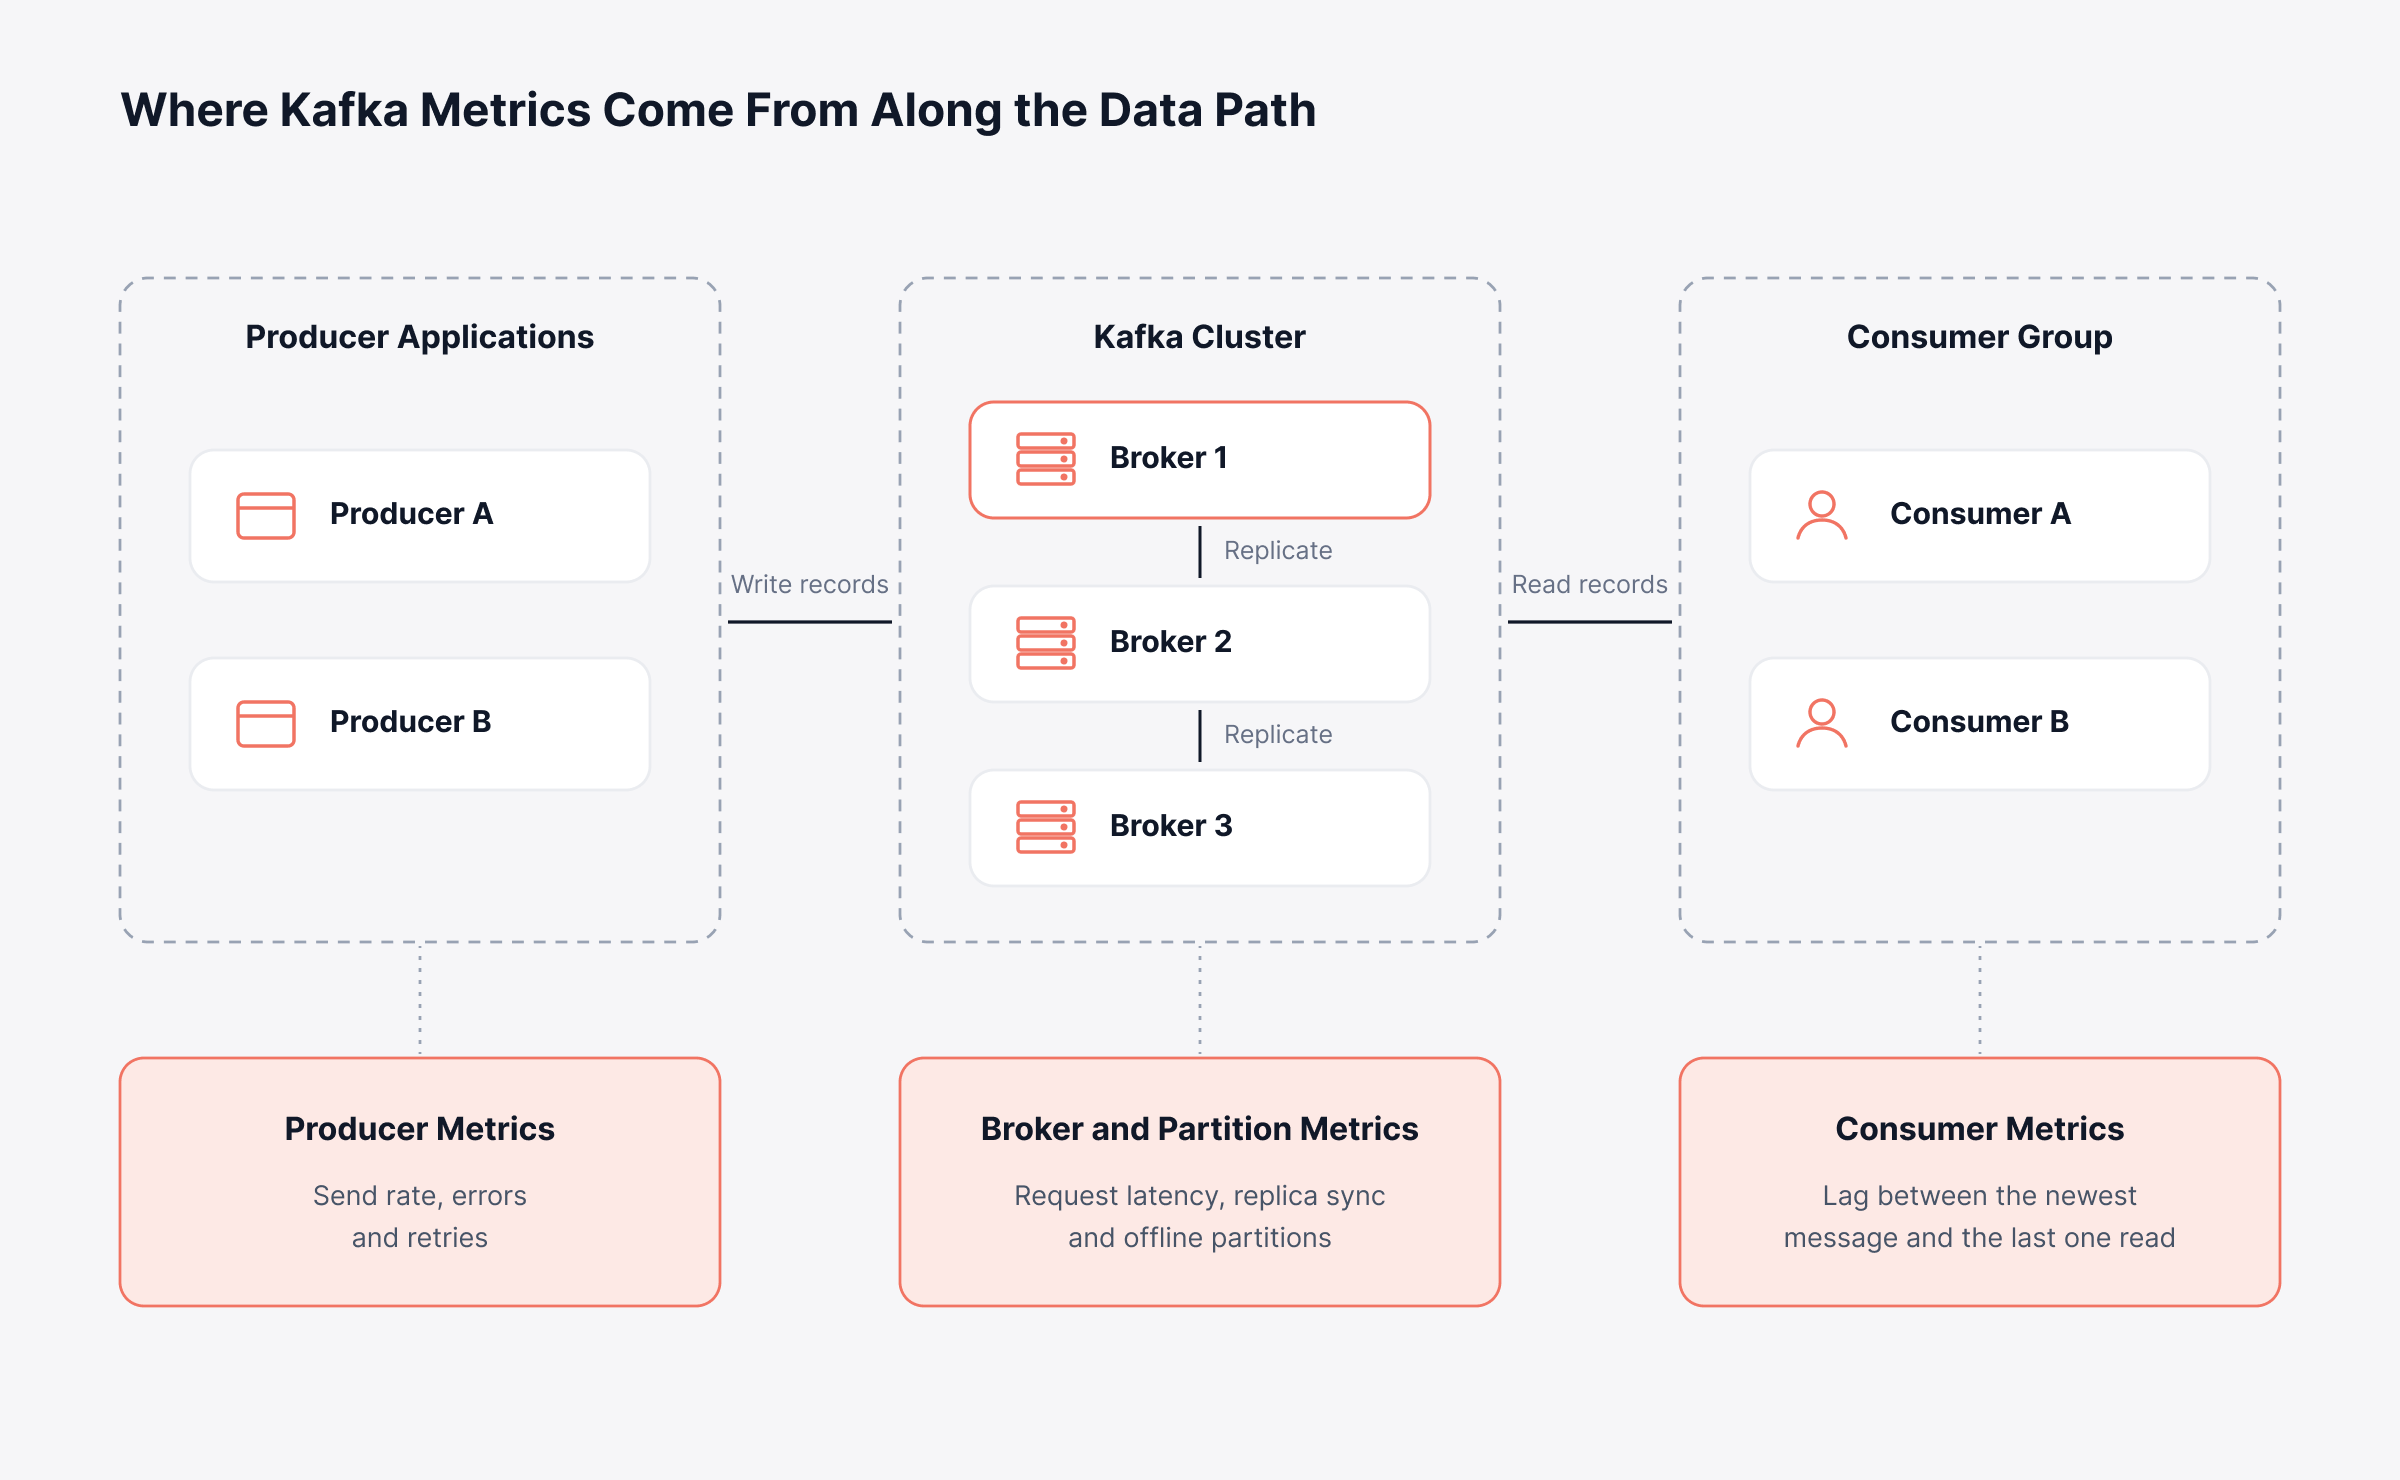
Label every alert with the stage of the data path it comes from, and responders know where to begin. Below, you'll find each metric group drawn at the point in the path where it is measured.
What Kafka Metrics Should You Monitor?
Kafka metrics worth monitoring split into five groups. We'll go through them one by one, starting with the brokers.
Most of them come out of JMX, the Java Management Extensions interface that both brokers and Java clients expose. Consumer lag works a little differently. You either calculate it from offsets yourself or pick it up from the consumer client, because the broker does not report it as a single metric.
1. Kafka Broker Metrics
Kafka broker metrics are where most investigations start. One broker that can't keep up will slow every partition it leads, so it pays to know each broker's normal throughput and request latency. Kafka broker monitoring is largely about spotting when a broker drifts away from that normal.
Throughput: Bytes and messages in and out per second, read against each broker's normal range
Request latency: Total time for produce and fetch requests, split into queue, local processing and response time
Thread idle time: Spare capacity left in the broker's request handler and network threads
Under-replicated partitions: Partitions whose replicas have fallen behind the leader
Active controller count: Which node currently manages cluster metadata
Request latency is easy to misread as one number, and it gets much more useful once you split it into parts. Queue time going up points to a saturated broker. When remote time goes up instead, the broker is usually waiting on its followers to replicate.
The same numbers feed capacity planning. Rising throughput plus shrinking thread idle time, month after month, means the cluster is running short of capacity. It's far cheaper to add brokers on your own schedule than in the middle of an outage.
2. Kafka Topic and Partition Metrics
Kafka topic and partition metrics are about where your data lives. You want it spread evenly across brokers, with enough copies that losing one broker loses nothing.
Leadership balance: Whether partition leaders are distributed evenly across brokers
In-sync replica (ISR) shrinks and expansions: How often replicas fall behind the leader, leave the in-sync set and rejoin
Under-min-ISR partitions: Partitions with fewer in-sync replicas than the topic's configured minimum, which can block writes
Offline partitions: Partitions with no active leader, which cannot be read or written at all
Log size and growth: Disk used per topic, checked against retention settings
Of everything on this list, offline partitions need the fastest alert. Even a count of one means some of your data can't be read or written at all. The services using it are already affected by the time that alert fires.
3. Kafka Consumer Metrics and Consumer Lag
Kafka consumer lag measures the backlog: the messages already written to a partition that a consumer group has not yet processed.
You get it by subtracting the group's committed offset from the log end offset, the slot where the producer's next message will land. On a busy topic, a few hundred messages of lag is often normal. What should worry you is lag that keeps climbing minute after minute, because then the consumers are falling behind.
Track lag per partition first, because a total across the topic can hide one partition that has stopped moving. The worked example below spells out how the two offsets produce the lag figure.
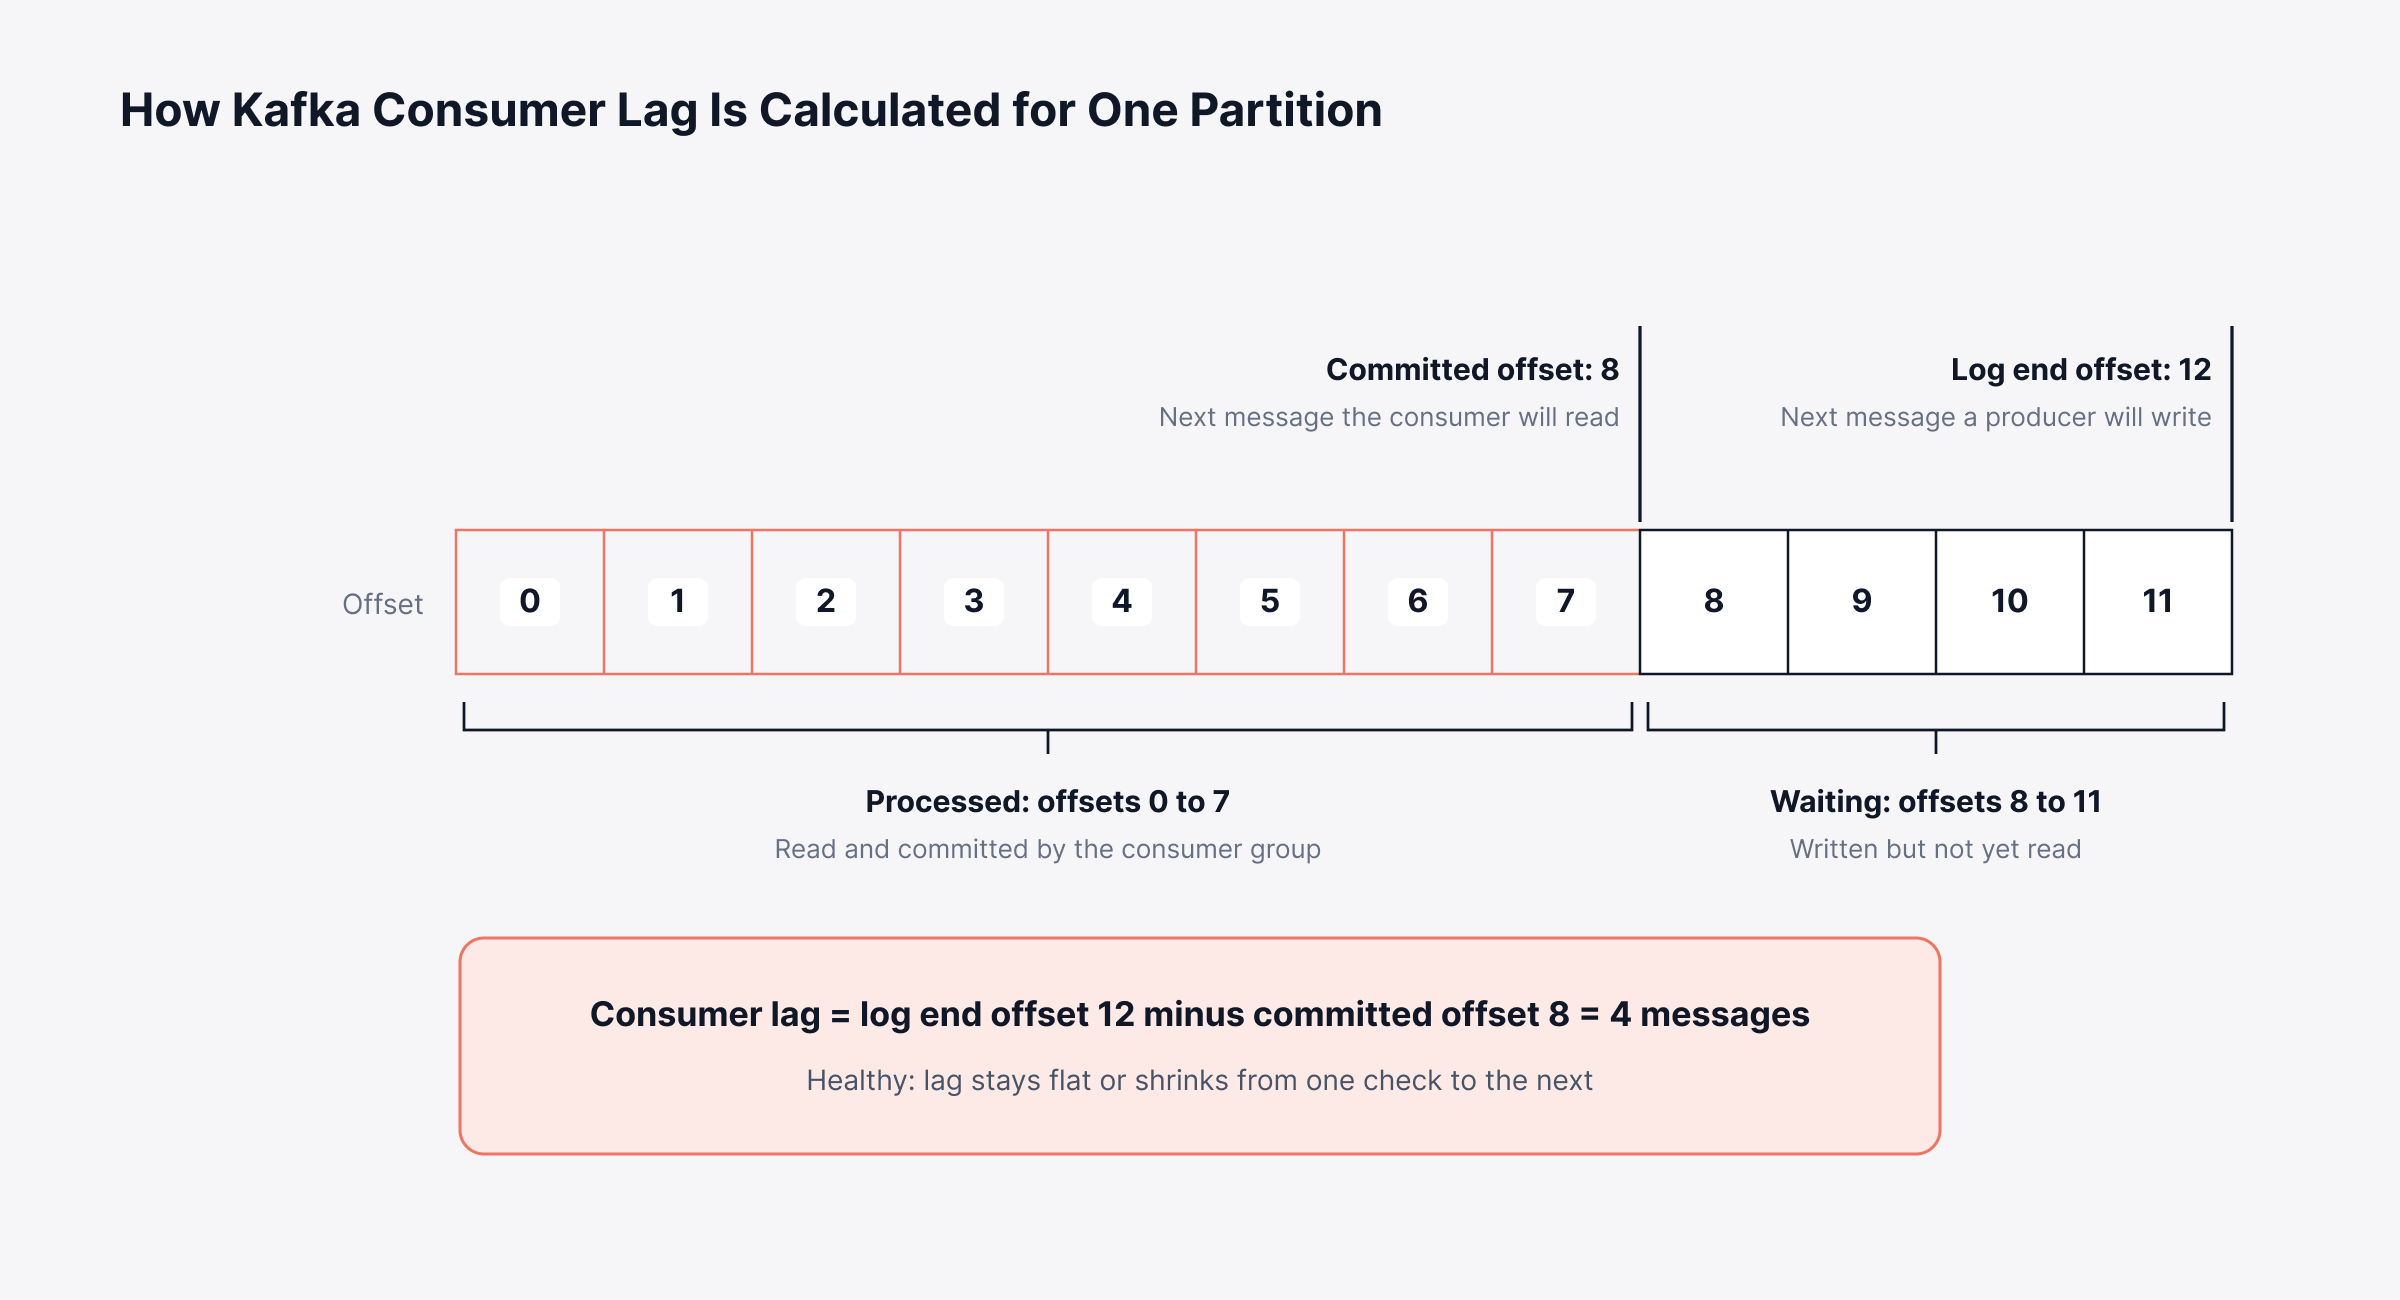
Alongside the lag figure itself, these consumer signals explain why lag is moving:
Records lag max: The largest lag across all partitions a consumer reads
Lag in time: The age of the oldest unprocessed message
Consumption rate: Records and bytes consumed per second, compared with the incoming rate
Rebalance frequency: How often the group reassigns partitions, since each rebalance pauses consumption
Commit latency and failures: Whether offsets are being saved reliably
When you report upward, use lag in time. Suppose your order-processing consumers are 40,000 messages behind while orders arrive at about 2,000 a minute, which means the oldest order has been waiting around 20 minutes. A business owner knows straight away whether that's acceptable.
4. Kafka Producer Metrics
Kafka producer metrics cover the write side, and trouble here tends to surface in your own applications before anywhere else. Users notice it as added latency on everyday actions.
Record send rate: Messages sent per second by each producer
Request latency: Time from sending a batch to receiving the broker's acknowledgment
Error and retry rates: Failed sends and the retries they trigger
Buffer availability: Free space in the producer's memory buffer, since a full buffer blocks the application
Of these, the retry rate is the one to watch. Retries usually climb before any errors appear, when brokers are under strain or partition leaders are moving around. Users can notice it first, too, since a checkout or form submission waits on those retries before any Kafka alert has fired.
5. JVM and Host Metrics for Kafka Brokers
JVM and host metrics show whether the machines and Java runtime under Kafka have the resources to run it. Since every broker runs on the Java virtual machine, what you already track in JVM monitoring carries straight over.
Heap usage and garbage collection pauses: Long pauses stop the broker and can push replicas out of sync
Disk usage and I/O wait: Kafka writes every message to disk, so slow or full disks hit throughput first
Network throughput: Replication traffic adds to client traffic, so links saturate earlier than expected
Open file handles: Each log segment holds file handles, and running out stops the broker
Many incidents blamed on Kafka turn out to start at this layer. So check host and JVM health early in triage. You'll save time, and you'll know sooner whether you're looking at a configuration fix or a hardware request.
What Are Healthy Values for Key Kafka Metrics?
Healthy values for key Kafka metrics come in two kinds. Replication signals have a fixed target of zero. For throughput, latency and lag, there's no universal number, so you compare each cluster with its own history.
The zero targets and the 30% idle-time guideline come straight from the Kafka documentation. Our alert rules are based on common operating practice. We've also added a column that spells out, in business terms, what each metric puts at risk.
Metric | Healthy value | When to alert | Business risk if ignored |
Under-replicated partitions | 0 | Above zero for more than a few minutes | Data loss if another broker fails |
Under-min-ISR partitions | 0 | Any value above zero | Writes rejected, producers stall |
Offline partitions | 0 | Any value above zero, at the highest priority | Data unavailable to every reader |
Active controller count | Exactly one node reports 1 | No node reports 1, or more than one does | Failovers and metadata changes stall |
ISR shrink rate | 0 outside planned restarts | Repeated shrinks with no maintenance underway | Rising risk of data loss |
Request handler idle time | Above 30% | Sustained values below 30% | Slower writes and reads under load |
Network thread idle time | Above 30% | Sustained values below 30% | Client timeouts at peak traffic |
Consumer lag | Stable or shrinking | Growing steadily over several intervals | Stale data in downstream decisions |
Broker disk usage | Headroom for retention plus growth | Projected to fill before retention clears old data | Broker outage when the disk fills |
Fixed thresholds suit the zero-value metrics. Lag, latency and throughput swing too much between workloads for one number to work, which is where anomaly detection against each cluster's history helps. Route its findings into real-time alerts, and on-call engineers get the context along with the page.
What Are Kafka Monitoring Best Practices?
Kafka monitoring best practices start small. Cover what the business would feel first, then add the rest as you learn the cluster's normal behavior.
Map topics to business services: Tag each critical topic with the service it supports, so an alert names the business impact
Page on replication and offline partitions first: These signal data loss or unavailability and need an immediate response
Report lag in time: Business owners can act on an age in minutes far more easily than on an offset count
Baseline before tuning thresholds: Collect a few weeks of normal behavior before setting alerts on throughput and latency
Pause alerts during planned work: Use time-bound alert suppression for brokers under maintenance, so planned restarts do not page anyone
Review after every incident: Add the metric that would have caught the problem earlier
There's a side benefit to tagging topics by service: when something breaks, leadership sees the business impact directly instead of waiting for an engineer to translate it. Business service monitoring makes that link visible without asking anyone to read broker metrics.
How Do Agent-Based and Agentless Kafka Monitoring Compare?
Agent-based Kafka monitoring runs a collector on each broker host. With agentless monitoring, nothing gets installed; metrics are pulled across the network, typically over JMX.
Once you know what to measure, there's still the question of how to collect it. Either approach can monitor Kafka well. The right fit depends mostly on the security policy for those hosts, though detail and rollout effort count too.
Factor | Agent-based | Agentless |
Depth of data | Host, JVM and process detail collected on the machine | Metrics the broker exposes remotely, usually through JMX |
Deployment effort | Install and update a collector on every broker | Configure remote access once for the cluster |
Security policy | Software runs on production hosts | Remote access ports and credentials need approval |
Network overhead | Collection happens locally on each host | Every poll travels across the network |
Best fit | Self-managed clusters where installs are allowed | Locked-down hosts that restrict new software |
Many organizations use both, with agents on self-managed brokers and agentless collection where installing software is restricted. If you are making the same call across a wider environment, our guide to agent vs agentless monitoring walks through it.
What Are the Common Kafka Monitoring Challenges?
The common Kafka monitoring challenges mostly come down to change, because the parts that decide a cluster's health shift all the time.
Partition skew: One hot partition can carry most of a topic's lag while cluster averages look healthy
Short-lived consumers: Autoscaled consumer instances come and go, so their metrics disappear in the middle of an investigation
Metadata mode changes: Recent Kafka releases manage metadata through KRaft controllers and no longer use ZooKeeper, which changes the controller metrics worth watching
Alert overload: Fixed thresholds on lag and latency fire during every traffic peak, and engineers soon start ignoring them
Hidden dependencies: Kafka decouples services, so the service that fails is often several hops away from the topic that slowed down
Hidden dependencies are the hardest of these, which is why monitoring Kafka pays off most next to dependency mapping of the services around it. Take a consumer that stalls on an inventory topic. The first complaint is wrong stock counts on a storefront two services away, and nobody thinks of Kafka until a map of who writes to and reads each topic narrows things down.
How Does Kafka Observability Go Beyond Monitoring?
Kafka observability adds the context that metrics alone can't give, by linking what the cluster reports to logs and traces from the applications writing and reading the data.
An alert only says that something crossed a line. Finding out why usually means looking past Kafka's own numbers, especially when the cause turns out to be in one of the applications around it.
Metrics: Show that lag, latency or replication changed, and when
Logs: Record broker errors, leadership changes and client exceptions around the same moment
Traces: Where services are instrumented, follow a request from the producing service through to the consumer and show where the time went
Combine all three and Kafka becomes one part of full-stack observability, where the trail from symptom to cause is much shorter. Business owners get something useful from it too: a clear record of which services were hit, and for how long.
What Should Kafka Monitoring Tools Cover?
Good Kafka monitoring tools cover all five metric groups, and they put that data beside the applications and infrastructure relying on Kafka.
Before you shortlist Apache Kafka monitoring tools, put these questions to each vendor:
Coverage: Does it collect broker, partition, consumer, producer and JVM metrics in one place?
Collection choice: Can it run both agent-based and agentless collection, so security policy does not force a single method?
Lag reporting: Does it show consumer lag as time as well as offsets?
Dashboards: Can a Kafka dashboard show cluster health beside the hosts and services that depend on it?
Alerting: Does it support baseline alerts for lag and latency, plus fixed alerts for replication signals?
Context: Can you move from a Kafka alert to the middleware monitoring, application and database data for the same incident?
Kafka performance monitoring is worth more when you read it next to the golden signals of the services consuming the data, which are latency, traffic, errors and saturation. If one Apache Kafka monitoring tool handles both, your engineers open fewer consoles during an incident. Procurement deals with fewer licenses, too.
How Does Motadata Monitor Apache Kafka?
Motadata now monitors Apache Kafka in ObserveOps, using agent-based or agentless collection depending on what each environment allows.
Discovery stays the same as well, since Kafka goes through the rediscovery settings flow ObserveOps already uses for other applications. That means one discovery process for new staff to learn, and no extra runbook to write.
Choose Agent-Based or Agentless Kafka Collection in ObserveOps
Having both options lets security policy make the call for each environment. The trade-offs from the comparison table earlier apply here directly.
Agent-based collection: Suits self-managed brokers where installing software on the host is permitted and host-level detail matters
Agentless collection: Suits hosts where new software is restricted, or clusters run by another group that will grant remote access but not installs
In practice, nobody has to rewrite a security policy just to get Kafka under monitoring.
Monitor Kafka Alongside Servers, Databases and Applications
You'll find Kafka in the same ObserveOps console you may already use for servers, databases, network devices and applications. If you also run ObserveOps APM, the service-level performance KPIs of your instrumented applications are right there too. That's one fewer tool to switch to in the middle of an investigation.
Move Kafka Out of a Standalone Console and Into Motadata ObserveOps
Apache Kafka monitoring is at its most useful when you watch replication, lag and broker health together, and read them alongside the services that rely on them. Standalone Kafka consoles go deep on the cluster itself. The applications, hosts and databases around it, though, are still in other tools.
Dedicated Kafka management tools still have their place, handling jobs like topic configuration and schema management that a broad monitoring platform isn't trying to replace. Where Motadata ObserveOps helps is monitoring and observability, putting Kafka in the same platform as the rest of your infrastructure with agent-based or agentless collection and a discovery flow your administrators already use. To see Kafka monitoring next to the other new additions, such as PostgreSQL cluster monitoring and more flexible alert suppression, read the ObserveOps release notes for this update.
FAQs
What is Apache Kafka used for?
Apache Kafka is a distributed event streaming platform that moves data between systems in near real time. Organizations use it for event-driven applications, log and metric pipelines, change data capture and stream processing.
What metrics can be monitored in Kafka?
Kafka exposes broker, topic and partition, consumer, producer and JVM metrics, mostly through JMX. For daily operations, the most important are under-replicated partitions, offline partitions, active controller count, request latency and consumer lag.
Is Kafka used for monitoring?
Kafka often carries monitoring data, moving logs, metrics and events from many sources to the tools that analyze them. Kafka itself also needs monitoring, since a delay in the cluster delays every dashboard and alert that depends on that data.
Can open-source dashboards be used to monitor Kafka?
Yes, Kafka JMX metrics can be exported to an open-source time-series database and charted on dashboards. The trade-off is upkeep, since exporters, alert rules and links to application data all need maintaining, which is why some organizations prefer a platform such as Motadata ObserveOps that monitors Kafka alongside the rest of their infrastructure.
Should Kafka be monitored with an agent or agentlessly?
Agent-based collection gives more host and JVM detail, while agentless collection avoids installing software on brokers and is often quicker to approve. Many organizations use both, and Motadata supports either method for Apache Kafka.
Author
Poonam Lalani
Content Strategist
Poonam Lalani is a B2B content strategist and writer with a background in computer engineering and experience across enterprise technology domains, including AI, cloud, DevOps, data engineering, and IT operations. She specializes in creating research-driven content that simplifies complex ideas and supports product education, thought leadership, and business growth.