How to Check Bandwidth Usage Across Your Network
Most bandwidth problems get investigated after the complaints arrive, and by then the traffic that caused them has moved on.
The numbers you need sit in several places at once. A laptop knows its own traffic. The router knows what leaves for the internet, and only the switches see how much network bandwidth moves inside the building.
Checking bandwidth usage at the right layer saves hours of guessing. Most of the methods ship with hardware you already own.
In this blog, you will:
Read live and historical usage on Windows, Linux and macOS with built-in tools.
Pull per-client traffic off a router, and see why those counters keep resetting.
Poll every interface with SNMP and use flow records to name the top talkers.
Judge what counts as high usage, and what to do about it.
By the end you will know which method answers which question.
How Do You Check Bandwidth Usage?
You check bandwidth usage by measuring traffic at the point that holds your answer. Use the endpoint for one machine, the router for the internet link, and SNMP or flow data for everything in between.
Picking the wrong point makes bandwidth investigations drag. A per-process tool on one laptop will never explain a saturated uplink, and an interface graph will never name the application that filled it.
Here is how the methods line up against the question you are trying to answer.
What you need to know | Where to check | Method | What it will not tell you |
One machine's live throughput | The machine itself | Task Manager, nload, Activity Monitor | Anything about other devices |
Which app on that machine | The machine itself | Resource Monitor, nethogs, nettop | Traffic that never touches it |
Daily and monthly totals | The machine itself | Windows data usage, vnstat | Live bursts as they happen |
The internet link total | Edge router or ISP portal | Router traffic page, ISP usage report | Which internal host caused a spike |
Per-device usage at one site | The router | Client list with traffic counters | History after a reboot |
Every interface on the network | Switches and routers | SNMP interface polling | Which application the bytes belonged to |
Who talked to whom, over what | Switches, routers, firewalls | Flow records | What was inside the packets |
Exactly what the traffic contained | A SPAN port or network TAP | Packet capture | Long-term trends, without heavy storage |
The first three rows take seconds. The last three take an afternoon of configuration, then run on their own for years.
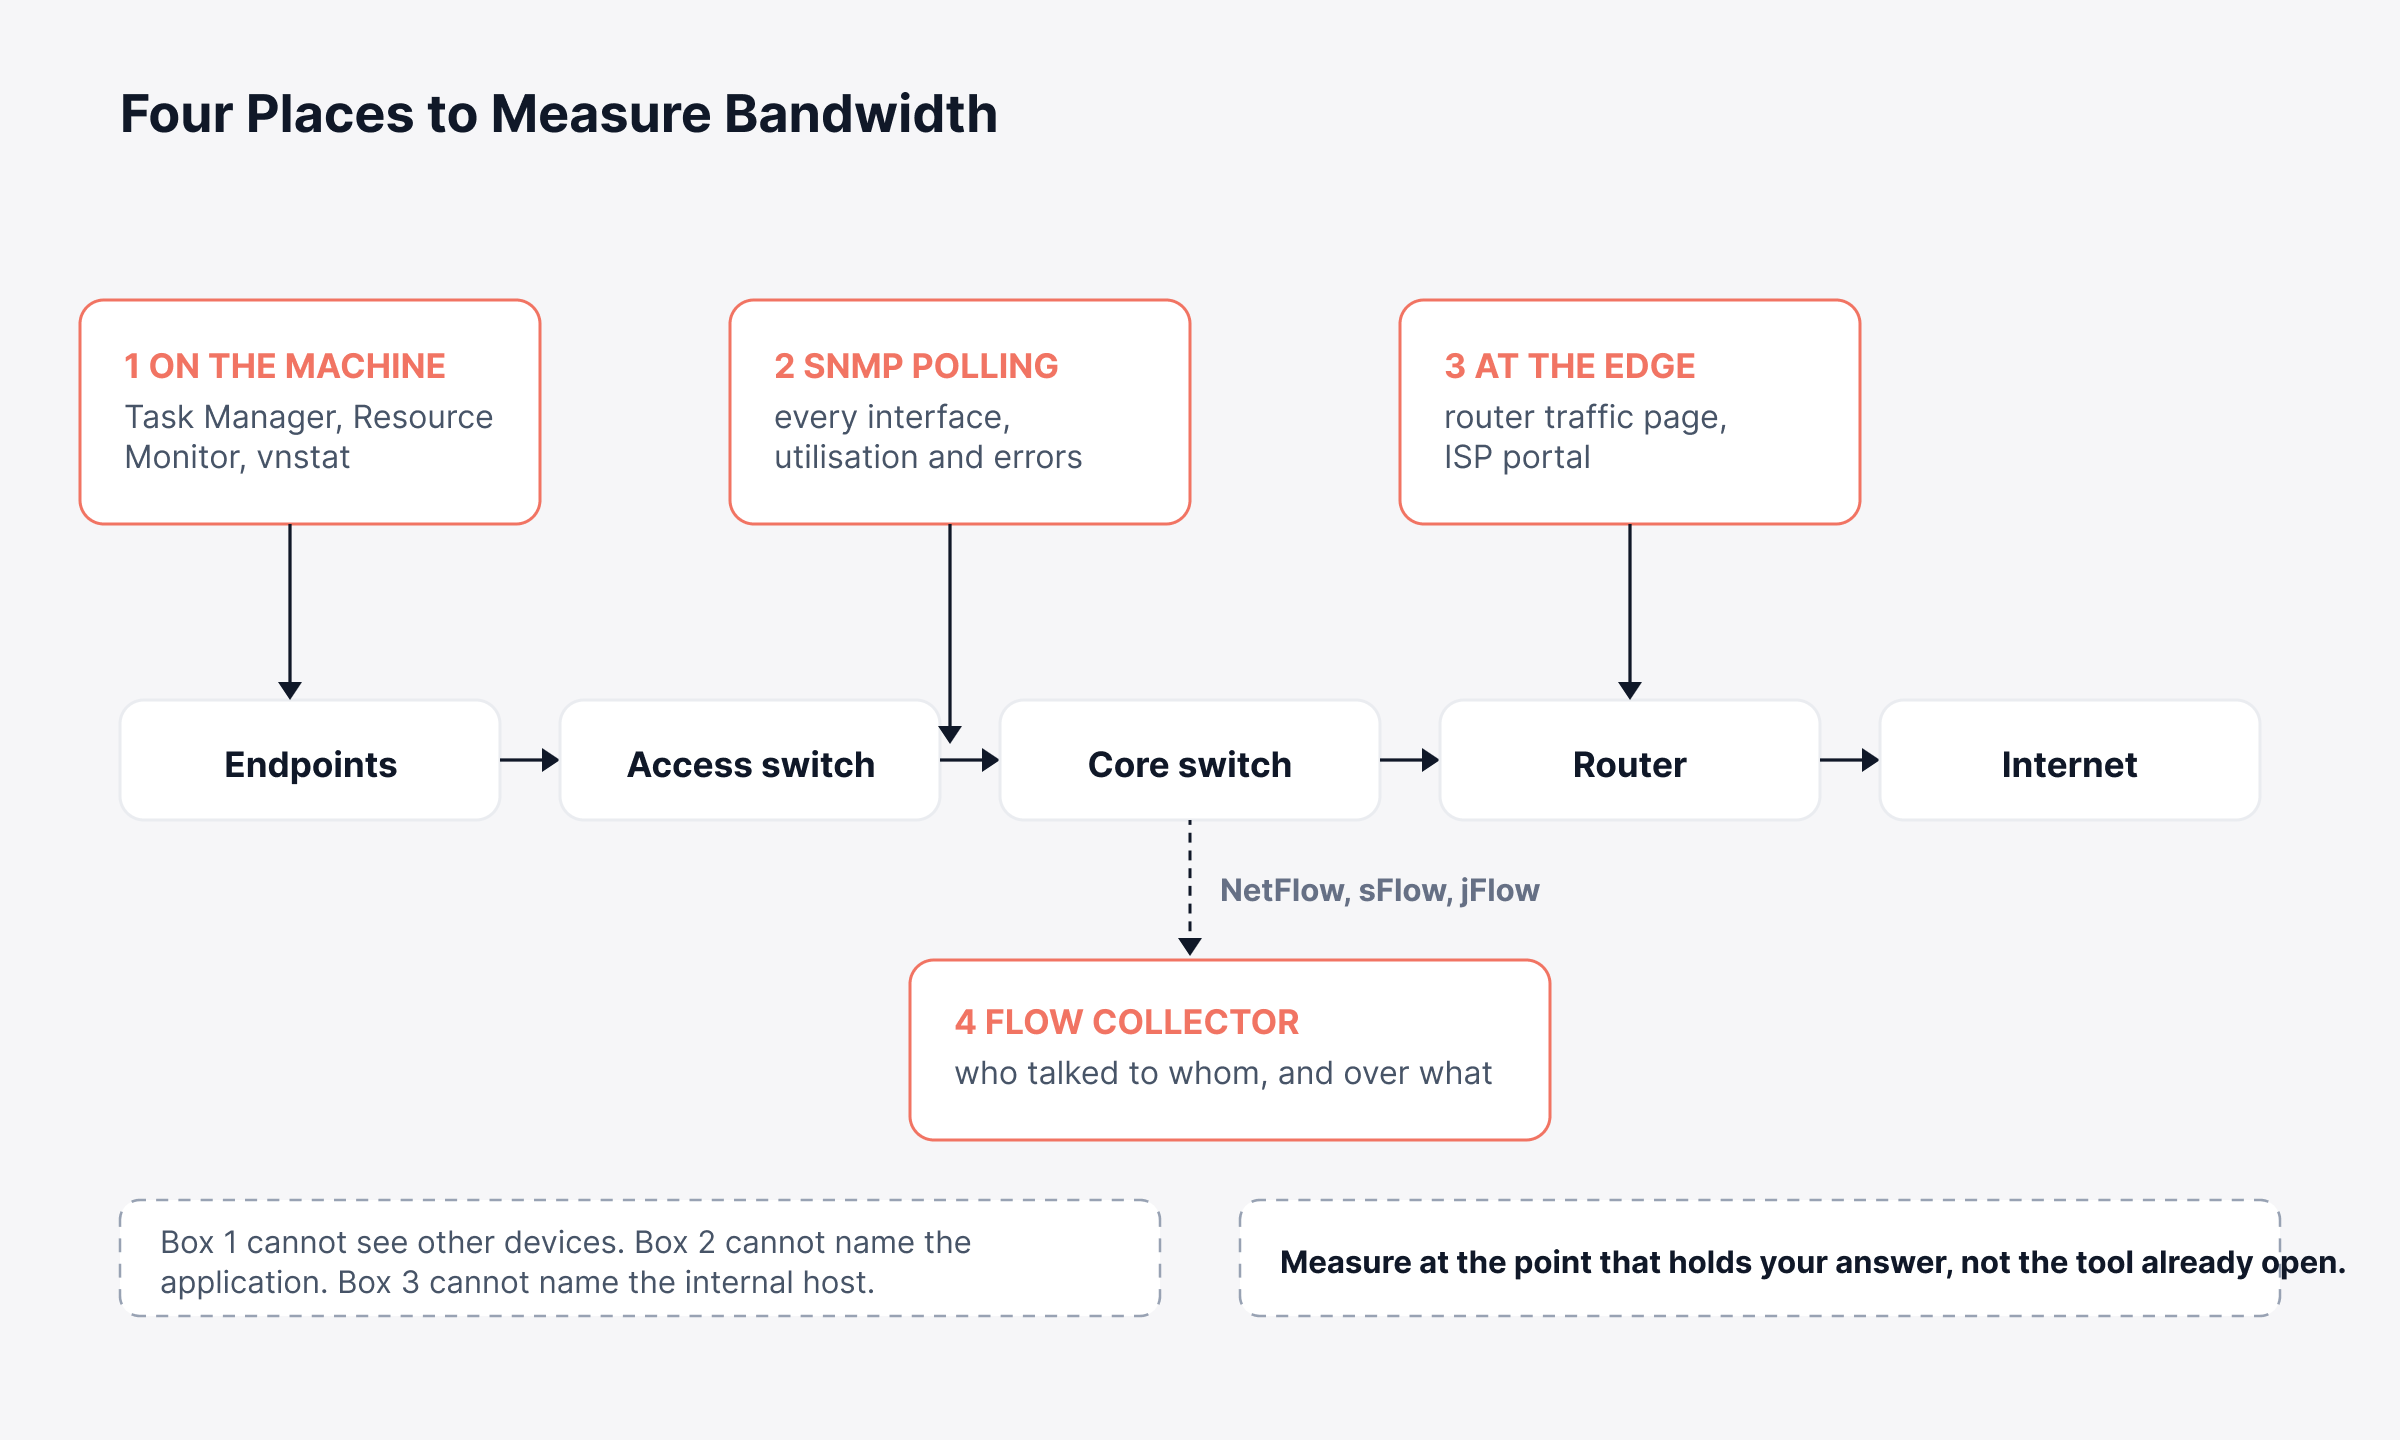
The diagram below shows where each of those measuring points sits on the network.
How to Check Bandwidth Usage on a Windows PC
Windows ships with four ways to read bandwidth usage, and each answers a different question. None of them needs an install or an administrator prompt.
1. Task Manager for Live Throughput
Task Manager shows what an adapter is moving right now. Press Ctrl+Shift+Esc, open the Performance tab, and select Ethernet or Wi-Fi.
The graph plots send and receive rates across a 60-second window, with the current figures listed underneath. Close it and that history disappears, so use Task Manager for a live reading and look elsewhere for history.
2. Resource Monitor for Per-Process Usage
Resource Monitor answers the question Task Manager cannot: which process is consuming the connection. Type resmon into the Start menu and open the Network tab.
The Processes With Network Activity panel lists every process with its send and receive rate in bytes per second. Sort by Total and the heaviest consumer rises to the top, usually a backup client, a sync agent or a browser tab nobody closed.
The panels below it earn a look too. TCP Connections shows which remote addresses each process is talking to, which turns a vague spike into a named destination.
3. Settings for 30-Day Totals
Windows keeps a running per-app total without being asked. On Windows 11 it sits under Settings, Network & Internet, Advanced network settings, Data usage. Windows 10 puts the same screen under Settings, Network & Internet, Data usage.
The list covers the last 30 days and sorts by volume. A photo sync client quietly uploading a library shows up here long before anyone spots it on a graph.
4. Command Line Counters
Two commands give you byte counters without opening a window at all.
Command | Where it runs | What it returns |
netstat -e | Command Prompt or PowerShell | Bytes and packets sent and received since the adapter came up |
Get-NetAdapterStatistics | PowerShell | The same totals per adapter, in a form you can script across a fleet |
Running netstat -e returns a short set of interface statistics.
Counter | Received | Sent |
Bytes | 1,854,329,110 | 284,119,442 |
Unicast packets | 1,842,093 | 987,114 |
Non-unicast packets | 14,209 | 3,311 |
Both counters reset when the machine reboots, so subtract two readings and ignore any single figure.
How to Check Bandwidth Usage on Linux and macOS
Linux and macOS split the same job across small tools. Picking one comes down to whether you want a live view or a history.
Five tools cover almost every situation.
Tool | What it shows | Getting it |
ip -s link | Cumulative bytes, packets and errors per interface | Already on every Linux host |
nload | A live incoming and outgoing graph for one interface | apt install nload |
iftop | Live bandwidth per host-to-host connection | apt install iftop |
nethogs | Live bandwidth grouped by process | apt install nethogs |
vnstat | Hourly, daily and monthly totals kept in a database | apt install vnstat |
Install vnstat before you need it, because nothing else in that list remembers anything. Its daemon records interface counters continuously and costs almost nothing to run.
Running vnstat -d -i eth0 prints the daily history for that interface.
Day | Received | Sent | Total | Average rate |
2026-09-21 | 41.29 GiB | 6.12 GiB | 47.41 GiB | 4.71 Mbit/s |
2026-09-22 | 38.84 GiB | 5.90 GiB | 44.74 GiB | 4.45 Mbit/s |
2026-09-23 | 12.03 GiB | 1.88 GiB | 13.91 GiB | 5.02 Mbit/s |
That history settles arguments about whether last Tuesday was unusual. Without it you compare a live reading against memory.
macOS covers the same ground with two built-ins. Activity Monitor's Network tab lists bytes sent and received per process, and nettop -m tcp gives you the live per-process view in a terminal.
How to Check Bandwidth Usage on Your Router
Only the router sees every packet heading for the internet, so it answers questions about the link as a whole.
Log in to the admin interface and look for a page called Traffic, Statistics, Bandwidth or Traffic Meter, depending on the vendor.
Most consumer and small-business routers list connected clients with a byte count beside each one. That alone often finds the device behind a slow evening.
The number comes with a catch worth knowing before you rely on it. Most consumer routers hold those counters in memory, so a reboot, a firmware update or a brief power cut resets them to zero.
Business-grade gear gives you a steadier reading. On Cisco IOS, show interfaces GigabitEthernet0/1 returns the rolling averages the interface already calculates.
Direction | 5-minute rate | Packets per second | Share of a 1 Gbps port |
Input | 412,839,000 bits/sec | 41,283 | 41% |
Output | 88,214,000 bits/sec | 12,094 | 9% |
Those averages cover five minutes, so they smooth out the same short bursts a five-minute SNMP poll hides.
Your ISP portal makes a third source, and the only one that counts for billing. It reports the monthly total against your contracted allowance, the figure any finance conversation will use.
All three stop at the edge. None of them answers which of forty switch ports is saturated, and for that you need something polling them all.
How to Measure Bandwidth Usage Across the Whole Network
Measuring the whole network means collecting from every interface on a schedule instead of checking devices one at a time. Three methods do that, and they answer progressively harder questions.
1. Poll Every Interface With SNMP
Nearly every monitoring platform measures bandwidth by polling SNMP. The monitor reads two counters from each interface, ifInOctets and ifOutOctets, waits, then reads them again.
The difference between the two readings, divided by the time between them, gives you throughput. Turning that into a percentage takes one line of arithmetic.
utilization % = (delta octets x 8) / (interval seconds x ifSpeed) x 100
Two details decide whether the result holds up. Counter width comes first, because the original 32-bit counters hold 4,294,967,296 bytes. A saturated 1 Gbps link fills that in about 34 seconds, and a wrapped counter then reads as a sudden drop to zero.
Use the 64-bit versions, ifHCInOctets and ifHCOutOctets, on anything faster than 100 Mbps. They need SNMP v2c or later, which every switch sold this decade supports.
Poll interval comes second. Five minutes is the common default, and it averages bursts into invisibility. A link that saturates for forty seconds every hour still looks comfortable in the graph, so poll at one minute on links you care about.
2. Read Flow Records to Find the Top Talkers
SNMP tells you how much traffic crossed an interface. Flow records tell you who sent it and what it was.
A flow record holds the source and destination IP addresses, the ports, the protocol, the byte and packet counts, and the start and end times. Exporting them turns a utilization graph into a ranked list of conversations, which is where most bandwidth investigations end.
The formats differ by vendor. NetFlow came from Cisco, jFlow from Juniper, sFlow ships on most Broadcom-based switches, and IPFIX standardizes the same idea.
One difference shows up in practice. sFlow samples rather than counting every packet, often one in 2,000, which keeps it accurate for volume and makes it likely to miss short flows.
Whichever format your hardware speaks, a collector has to normalize it first. NetFlow traffic monitoring is where most teams start, and mixed estates usually end up running two exporters into one collector.
Motadata ObserveOps collects NetFlow, sFlow and jFlow into a Flow explorer that breaks usage down by user, application, protocol and IP address group.
We reach for it when a link sits at 90 percent and nobody can say why. Tracing a conversation between two endpoints then takes a filter, not an afternoon with Wireshark.
3. Capture Packets When Nothing Else Explains It
Packet capture stays a last resort, and it remains the only method that shows the traffic itself rather than a summary. You need a SPAN port, a mirrored VLAN or a network TAP, then tcpdump or Wireshark on the receiving end.
Storage explains why it stays last. A saturated 1 Gbps link produces roughly 450 GB of capture every hour, so filter hard and keep any capture to minutes.
Running the first two continuously turns bandwidth from a spot check into a signal. A signal belongs next to the rest of your telemetry, inside a unified observability and ITSM platform, not a standalone meter. A utilization spike then lands on the same timeline as the tickets it generated.
How Does Bandwidth Affect Network Performance?
Bandwidth affects network performance by setting a ceiling on throughput, and that ceiling only matters once demand climbs close to it.
It does not control speed the way most people expect. A 10 Gbps link and a 100 Mbps link between the same two cities deliver the first bit at the same moment. That delay comes from distance and equipment, not from capacity.
Rising load turns capacity into a performance problem in three stages.
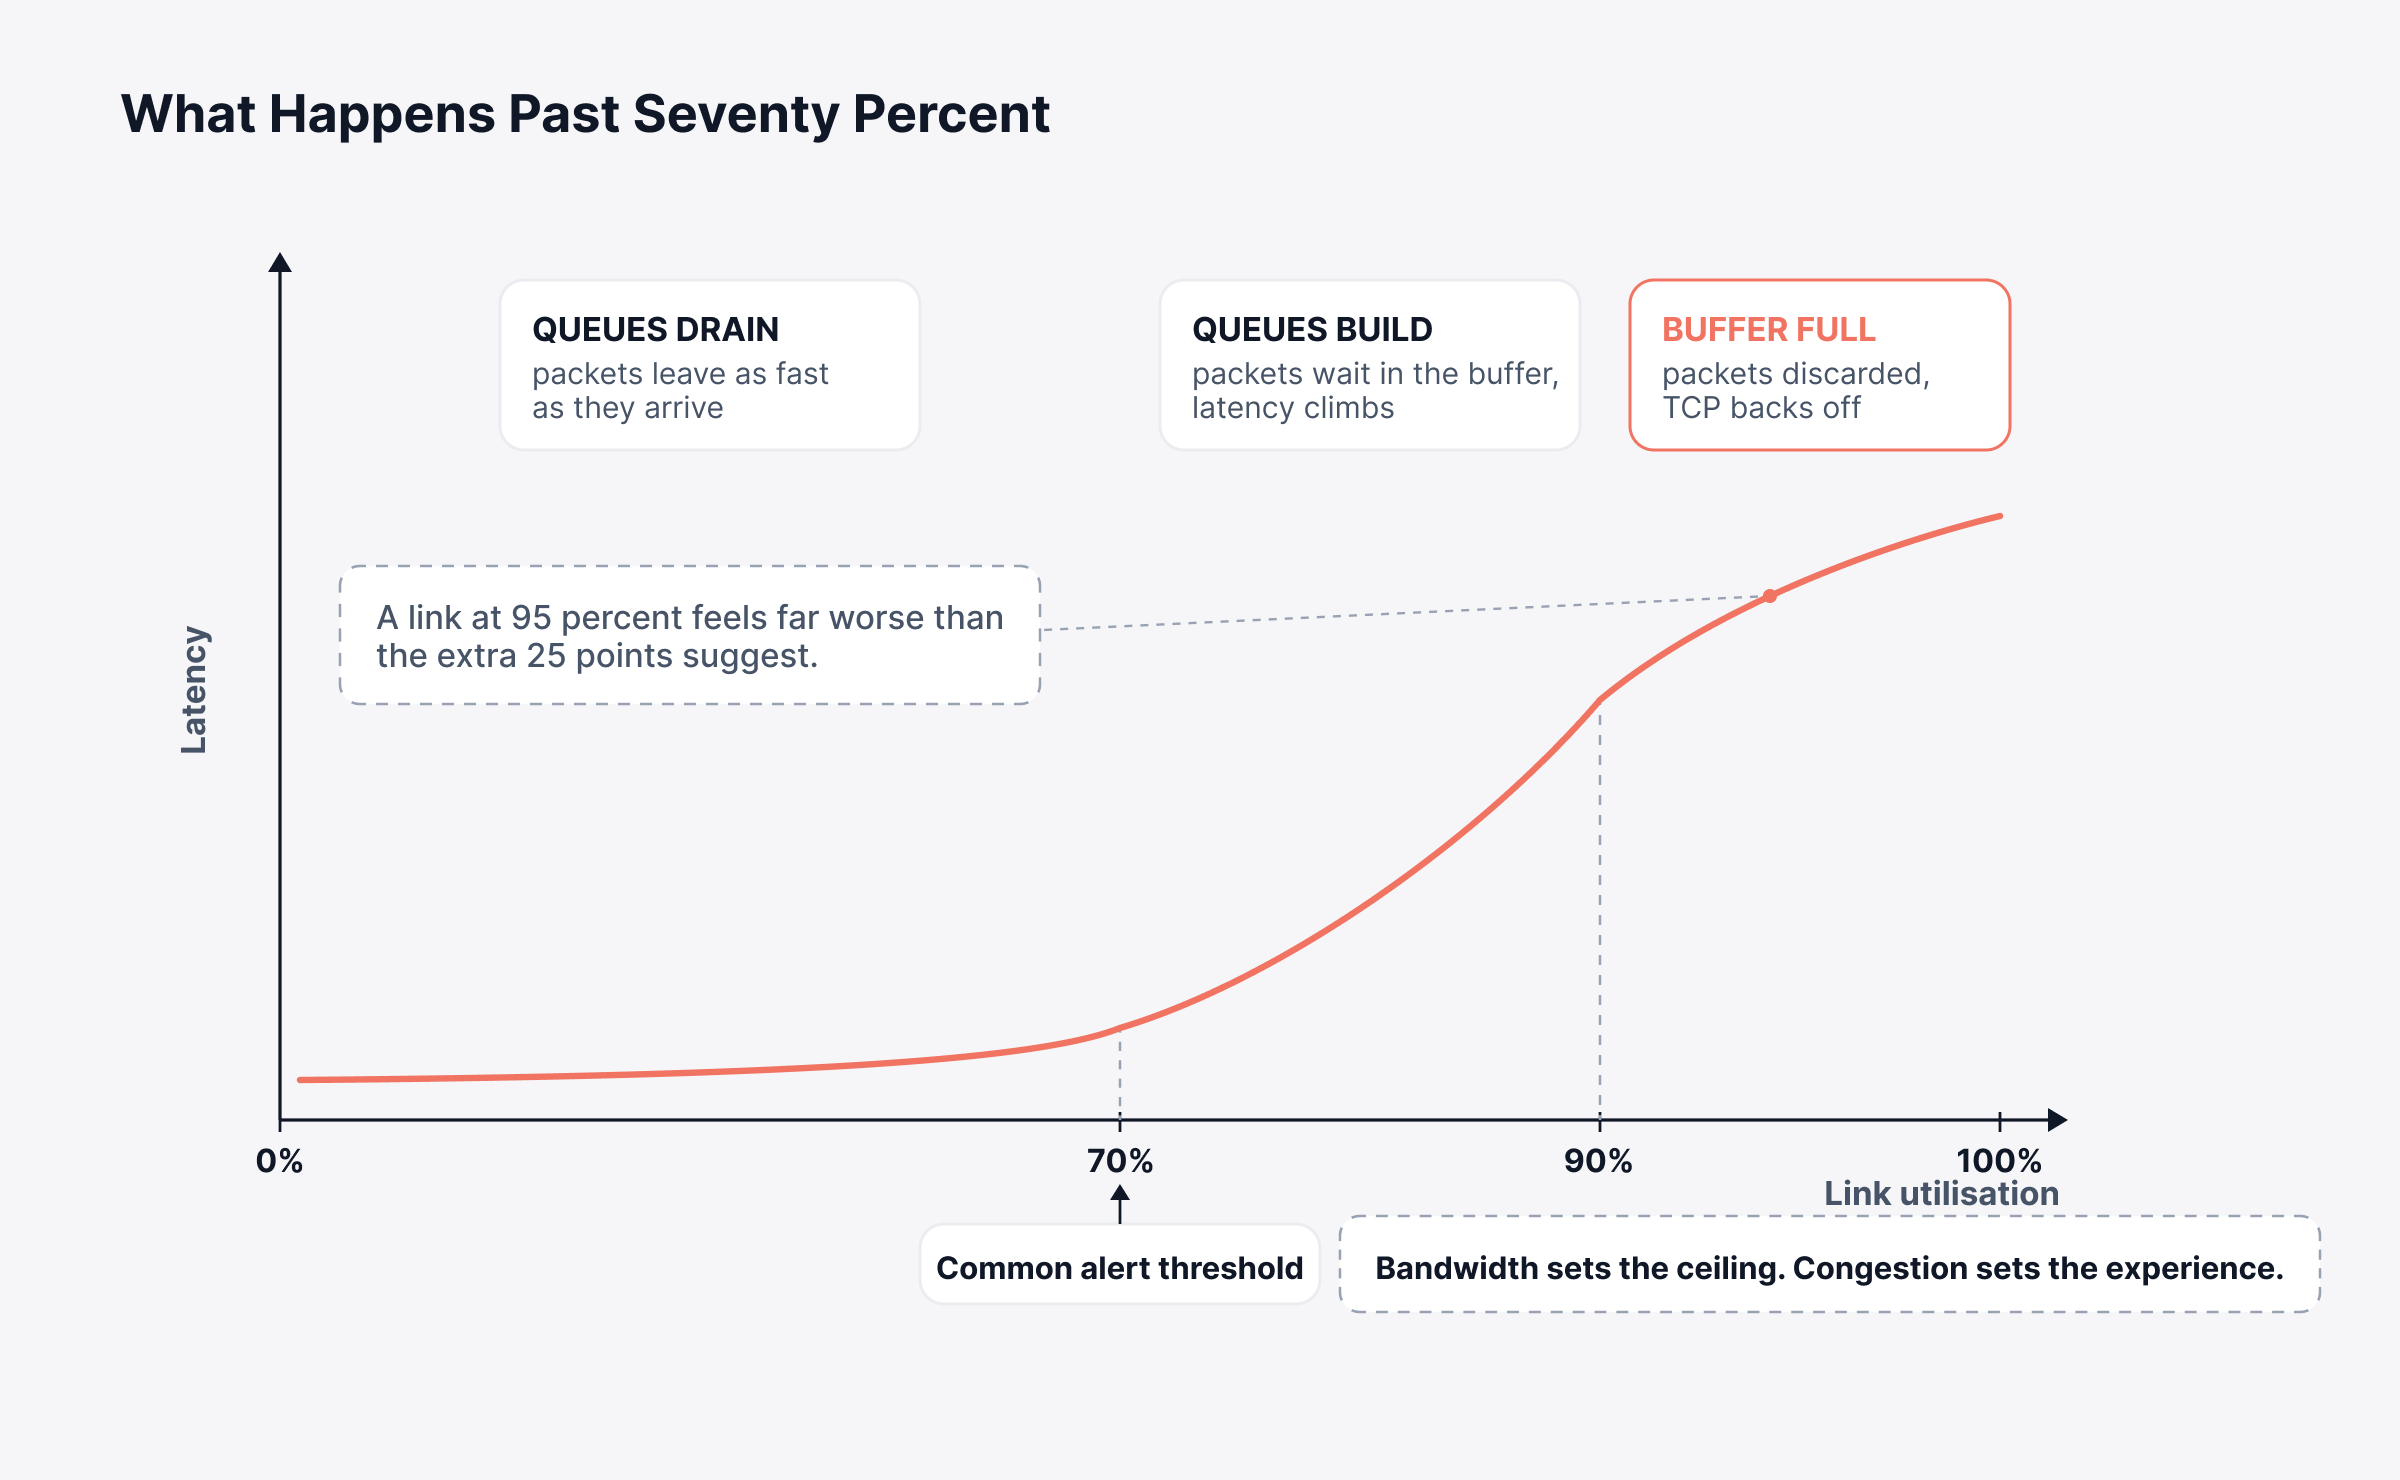
Below 70 percent utilization: Queues stay short and packets leave about as fast as they arrive. Bandwidth stays invisible to users at this point.
Between 70 and 90 percent: Bursts start arriving faster than the interface can drain them. Packets wait in the buffer and latency climbs while throughput still looks healthy.
Above 90 percent: The buffer fills and the interface begins discarding packets. TCP reads those discards as congestion and backs off, so throughput falls at the moment users need it most.
A link at 95 percent therefore feels far worse than the extra 25 points of utilization suggest. Packet loss reports and slow application complaints usually arrive in the same ten minutes.
The curve below traces that whole sequence, from a quiet link to one that has run out of headroom.
One practical consequence follows from all of this. Adding capacity fixes slowness caused by congestion. It does nothing for an application waiting on round trips, so a chatty database call across a WAN stays slow on a fatter pipe.
What Counts as High Bandwidth Usage?
Most teams treat sustained utilization above 70 to 80 percent as high bandwidth usage. The number matters less than the shape around it.
The same percentage can be routine in one context and urgent in another. These four readings show how much the surrounding context changes the verdict.
What you see | Verdict | Why |
95% for thirty seconds during a backup window | Normal | A short burst with a known cause |
75% through every working afternoon | Act on it | No headroom left for a bad day |
65% on a weekday afternoon | Normal | Matches what the site does every week |
65% at 3 a.m. | Investigate | Nothing scheduled should be using that capacity |
Billing adds a second test. ISPs selling burstable capacity charge on the 95th percentile. They sample the link every five minutes across the month, discard the top 5 percent of samples, and bill on the highest figure left.
A handful of sharp spikes therefore costs nothing, and a steady climb costs money every month.
Track consumption for two weeks before you set a single threshold. Alerts written against a guess generate noise that teams learn to ignore.
What to Do When Bandwidth Usage Is Too High
When usage runs too high, find the source before you buy capacity. Plenty of spikes turn out to be a misconfigured backup window or an unmanaged cloud sync, and neither one needs a bigger circuit.
Work through these in order.
Name the top talkers. Pull the ranked conversation list from flow data for the window when the link was busiest.
Decide whether the traffic belongs. A nightly replication job and an unmanaged cloud backup look identical on a graph and call for opposite responses.
Protect the sensitive traffic with quality of service. Voice and video suffer first under congestion, so give them priority over bulk transfers.
Move what can wait. Backups, patch distribution and image pulls run just as well at 2 a.m., and rescheduling them costs nothing.
Upgrade last. Buy capacity once the first four steps have run and the link is still saturated with traffic you need.
That order saves money. Teams that skip to step five pay for a larger circuit and watch it fill with the same traffic inside a quarter. Every technique that helps you reduce bandwidth consumption costs less than the upgrade.
Start Measuring Bandwidth Usage Before You Buy More of It
The right method is the one that matches your question. A per-process tool answers a complaint about one laptop, and flow records answer a saturated uplink. Reaching for the wrong one turns a ten-minute check into an afternoon.
Getting the network-wide view running costs real effort. SNMP needs credentials on every device, and flow export needs configuration on the gear carrying the traffic. Both take an afternoon you would rather spend elsewhere.
The payoff arrives the next time someone says the network is slow. With a baseline behind you and bandwidth monitoring already collecting, the answer sits one filter away instead of a week out.
FAQs
Is a speed test the same as checking bandwidth usage?
No, the two measure different things. A speed test generates its own traffic to find the capacity available right then. Checking bandwidth usage measures the traffic already flowing across the link.
Can you check bandwidth usage without installing anything?
Yes, every operating system ships with what you need. Task Manager, Resource Monitor and netstat -e cover Windows, ip -s link covers Linux, and Activity Monitor with nettop covers macOS.
How often should bandwidth usage be polled?
Poll every one to two minutes on links carrying production traffic. Five-minute polling suits capacity planning, though it averages short bursts away and hides the saturation behind intermittent complaints.
Does monitoring bandwidth add load to the network?
Monitoring adds very little load. SNMP polling and flow export together use well under one percent of link capacity in most environments. Full packet capture is the exception, because mirrored traffic doubles what the capture segment carries.
Why does a router report different usage than a monitoring tool?
They measure at different points and over different windows. A router counts bytes since its last reboot, while ObserveOps calculates rates between polls, so counter resets and sampling intervals explain most of the gap.
Author
Ramya Shah
Technical Writer
Ramya Shah is a technical content writer with a computer engineering background and roots in automotive journalism. He covers IT Service Management, observability, IT operations, and AI-driven automation. An early adopter of AI-assisted writing workflows, he turns complex IT processes into clear, engaging content optimized for search and answer engines (AEO), lifting content output and organic visibility.