10 Best IT Operations Management Tools (ITOM) Compared for 2026
No IT team sets out to run ten monitoring tools. It happens one purchase at a time. You add a network monitor after one outage, a server monitoring tool after the next, then a log analyzer, then an APM product when the app team gets tired of guessing.
Then something breaks, and every one of those tools has an opinion. Each fires its own alerts. None of them agrees on the cause, and the first hour of the incident goes to deciding which screen to believe. That sprawl is what IT operations management tools exist to fix.
And it gets expensive fast. According to the ITIC, one hour of downtime now costs most large enterprises more than $300,000. Every minute your team loses flipping between consoles to find the cause adds to that.
Good ITOM software fixes this. It puts every signal in one place, then leans on AI to filter the noise down to the alerts that actually matter. This guide compares ten of the strongest options for 2026.
In this blog, you will find:
A plain definition of what IT operations management software actually does.
A side-by-side table comparing all ten tools on coverage, deployment, AIOps, and price.
An honest review of each tool, with real pros and cons, ObserveOps included.
A buyer's checklist and a decision guide matched to your environment.
By the end, you will know which two or three are worth a trial for a stack like yours.
What Is IT Operations Management (ITOM)?
IT operations management (ITOM) is the work of keeping IT infrastructure healthy and running. Think networks, servers, cloud services, and the applications and business services on top of them.
The word covers both the practice and the software that supports it. The goal sounds simple: keep everything up, keep it fast, and spot trouble before users do. Doing that across a sprawling estate is the hard part.
To do that, a modern ITOM tool gathers four kinds of data: metrics, logs, network flows, and traces. All of it lands in one view.
The better tools then add AIOps to tie related events together, quiet the alert noise, and point at the cause. A few go further and fix routine problems on their own, before anyone has to step in.
ITOM and ITSM get mixed up a lot. Here is the quick split: ITOM keeps the infrastructure healthy, while ITSM handles the tickets, requests, and changes around it. We go deeper on the difference between ITOM and ITSM elsewhere. The best setups wire them together, so a monitoring alert can open a ticket by itself.
How We Evaluated These Tools
We put every tool through the same five questions. The data behind them comes from vendor docs, public pricing pages, and G2 and Gartner Peer Insights ratings current as of mid-2026.
Breadth of coverage: Whether one tool can watch network, servers, cloud, apps, logs, and flows, or just one slice of that?
AIOps and noise reduction: Whether it can correlate events and surface root cause, or does it just pile on more alerts?
Deployment flexibility: SaaS, on-prem, hybrid, and whether it can run inside a regulated or data-residency-bound estate.
Automation and remediation: What happens after the alert fires, from runbooks to auto-fixes to a clean ticket handoff?
Pricing and total cost: How the bill actually moves as your hosts, data, and modules grow.
Now, let’s get a brief overview of the top ITOM tools before we go into details.
The 10 Best ITOM Tools Compared
Here is a quick side-by-side before the detailed reviews.
Tool | Best For | ITOM Focus | Deployment | AIOps / Correlation | Starting Price |
1. Motadata ObserveOps | Unified hybrid and on-prem IT ops with native AIOps | Network, server, cloud, log, flow, APM, RUM | SaaS, on-prem, cloud (6 modes, HA/DR) | Yes, DFIT AI: correlation, anomaly detection, triangulation | Quote-based |
2. ServiceNow ITOM | Enterprise ITOM with CMDB and service mapping | Discovery, CMDB, event management, AIOps | SaaS (Now Platform) | Yes, event correlation and predictive AIOps | Quote-based |
3. Dynatrace | AI-driven full-stack observability | Observability, APM, infra, AIOps | SaaS and Managed | Yes, Davis AI root cause and topology | ~$69/mo per host |
4. Datadog | Cloud-native and Kubernetes monitoring | Infra, APM, logs, metrics | SaaS only | Yes, Watchdog anomaly detection | $15/host/mo |
5. Splunk (ITSI) | Log-driven operational intelligence at scale | Log analytics, event correlation, ITSI | SaaS, self-hosted, hybrid | Yes, ITSI ML correlation and prediction | Quote-based |
6. LogicMonitor | Automated hybrid infrastructure monitoring | Infra, network, cloud, AIOps | SaaS (agentless collectors) | Yes, Edwin AI and dynamic thresholds | $16/resource/mo |
7. ManageEngine OpManager | Affordable network and server monitoring | Network, server, VM monitoring | On-prem and cloud | Limited, thresholds and forecasting | From $95/yr (10 devices) |
8. SolarWinds Hybrid Cloud Observability | Network-centric hybrid monitoring | Network, server, app, hybrid | On-prem and SaaS | Yes, AIOps in SaaS tier | From $8/node/mo |
9. New Relic | DevOps teams wanting usage-based telemetry | APM, infra, logs, telemetry | SaaS only | Yes, anomaly and incident correlation | Free tier; then $0.40/GB |
10. BMC Helix Operations Management | Enterprise AIOps for complex hybrid estates | AIOps, event management, service monitoring | SaaS and on-prem | Yes, ML event correlation and causal AI | Quote-based |
Now, let’s take a detailed look at each of these top IT operations management tools.
Detailed Overview of the 10 Best ITOM Tools in 2026
Here is a closer look at each tool, what it does well, and where it falls short.
1. Motadata ObserveOps
Best for: Enterprises and IT or NOC teams that want network, server, cloud, log, flow, and application monitoring unified in one observability platform.
Rating: G2 4.7/5, Gartner Peer Insights 4.6/5
Pricing: Quote-based, contact sales.
Most ITOM stacks are stitched together from parts: a network tool, a server tool, a separate log analyzer, an APM product added after the last outage.
ObserveOps replaces that pile with one platform It takes in metrics, logs, flows, traces, and topology under a single AI engine called DFIT.
Motadata calls the result triangulation. Your logs are read together with metrics and network flows, so root-cause analysis covers all three at once instead of one silo at a time.
That AI runs on Motadata's Deep Learning Framework for IT Operations (DFIT). It is adaptive, so it does not need weeks of training before it starts finding problems.
Motadata runs IT operations for over 500 enterprises in 30-plus countries, Central Bank of India among them. It is built for teams that run their own infrastructure, not only cloud-first shops.
Don’t take our word for it; check out this review from one of our many satisfied customers on G2:
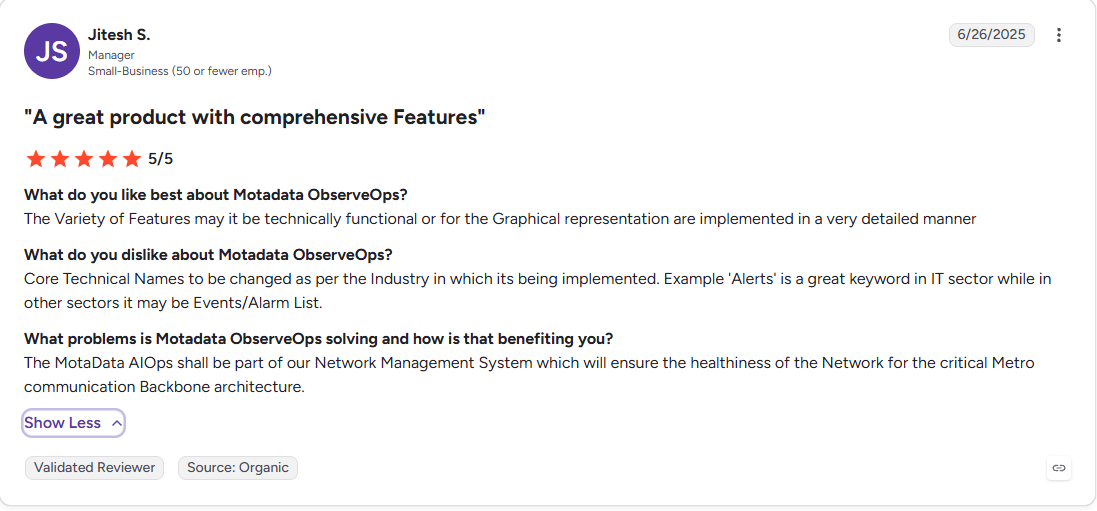
Check out more G2 reviews here.
Pros
- Genuinely unified, so one platform can replace separate network, APM, log, flow, and observability tools.
- Six deployment modes, including on-prem, high availability, and disaster recovery, which suits banking, government, and other regulated estates.
- The AI-driven correlation and anomaly detection are part of the platform, not a premium add-on.
- Broad out-of-the-box coverage and OpenTelemetry-native ingestion, so onboarding new sources is quick.
Cons
- It is a full platform. A team that only needs one job done, such as plain network monitoring, may not need all the breadth.
- Pricing is quote-based, with no public per-host or per-device number to model against.
- The third-party review footprint is smaller than Datadog's or Dynatrace's, so there is less peer feedback to lean on.
- Brand recognition in Western markets trails the long-established incumbents.
2. ServiceNow ITOM
Best for: Large enterprises already on the Now Platform that want ITOM built around a strong CMDB, discovery, and service mapping, wired to ITSM.
Rating: G2 4.4 out of 5. Gartner Peer Insights 4.3 out of 5.
Pricing: Quote-based, licensed on the Now Platform. No public list price.
ServiceNow ITOM is the CMDB heavyweight. Discovery and service mapping feed one system of record, and Health Log Analytics adds predictive AIOps on top. It shines when you already run ServiceNow ITSM.
In that setup, a monitoring event and the ticket it raises sit in the same place. That tight asset discovery and mapping is why big enterprises pick it.
The trade-off is scope and effort. ServiceNow leans toward event management and the CMDB, not deep infrastructure monitoring the way Datadog or LogicMonitor do it. Many teams still run a dedicated monitoring tool next to it.
Pros
- Deep, mature CMDB and service mapping.
- Unifies ITOM with ITSM in one workflow.
- Deep automation and orchestration across the Now Platform.
Cons
- Expensive, and complex to implement well.
- Real value depends on buying into the wider ServiceNow ecosystem.
- Lighter on raw infrastructure monitoring than dedicated tools.
- Long time to value.
3. Dynatrace
Best for: Enterprises wanting AI-driven, full-stack observability with automatic root-cause analysis across cloud-native and hybrid apps.
Rating: G2 4.5 out of 5. Gartner Peer Insights 4.6 out of 5.
Pricing: Full-stack monitoring from about $69 per month per 8 GiB host, on a consumption model. Logs and other modules are priced separately.
Dynatrace built its name on the Davis AI engine. Davis maps your topology on its own and points to a single, clear root cause with little manual setup.
At the microservices scale, that saves real hours. You install one agent, appropriately named ‘OneAgent’, and it instruments the whole stack from there.
The catch is cost and fit. Its consumption pricing is strong but hard to predict, and the platform can feel like too much for a small or simple estate.
Pros
- Exceptional automated root cause with minimal tuning.
- Deep automatic topology discovery.
- Strong at cloud-native and microservices scale.
Cons
- Premium pricing, and a consumption model that is hard to predict.
- Can be more than smaller estates need.
- On-prem (Managed) is less common than the SaaS path.
4. Datadog
Best for: Cloud-native DevOps and SRE teams that want infrastructure, APM, and logs correlated in one polished SaaS.
Rating: G2 4.4 out of 5. Gartner Peer Insights 4.6 out of 5.
Pricing: Infrastructure monitoring from $15 per host per month (annual). Logs, APM, and 20-plus other modules are billed on top.
Datadog wins on breadth and polish. It ships more than 700 integrations, sets up fast, and has a clean interface. Once your data is flowing, it links metrics, traces, and logs well. For a Kubernetes-heavy, cloud-first team, it is often the first pick.
The trouble is the bill. Each capability is a separate module, so costs climb fast and get hard to predict as hosts and data grow. There is also no on-prem option if you need one.
Pros
- Huge integration catalog and quick setup.
- Strong cross-signal correlation.
- Polished, approachable interface.
Cons
- Costs escalate fast across separate modules.
- SaaS only, with no on-prem deployment.
- Per-feature add-ons can sprawl and get hard to forecast.
5. Splunk (ITSI)
Best for: Data-intensive enterprises and SecOps teams that want log-driven operational intelligence and event correlation at massive scale.
Rating: G2 4.3 out of 5. Gartner Peer Insights 4.5 out of 5.
Pricing: Quote-based, on an ingest or workload model. IT Service Intelligence is a premium add-on.
Splunk is the machine-data powerhouse. Its SPL search language runs deep, and IT Service Intelligence adds service-level KPIs, event correlation, noise reduction, and prediction on top.
If your operations run on logs and the budget is there, little else matches its analytical reach or its Splunkbase ecosystem.
The catch is almost always cost. Ingest-based pricing is powerful but hard to keep under control, and SPL takes real time to learn.
Pros
- Extremely powerful search and analytics.
- Battle-tested at enterprise scale.
- Deep tie-in to security use cases.
Cons
- High, ingest-driven cost that is hard to predict.
- Steep SPL and administration learning curve.
- ITSI is a separate premium add-on, and pricing is quote-only.
6. LogicMonitor
Best for: IT teams that want automated, agentless monitoring across hybrid infrastructure without the weight of an enterprise suite.
Rating: G2 4.5 out of 5. Gartner Peer Insights 4.5 out of 5.
Pricing: From about $16 per resource per month (Essentials, list). Advanced and Signature tiers cost more.
LogicMonitor sits in a useful middle ground. It finds your devices on its own and covers network, server, and cloud out of the box.
It runs as a SaaS with agentless collectors, so setup is quick. Its Edwin AI adds AIOps for teams that want correlation without building it themselves.
Pricing is per resource. That looks clean at first and climbs as your estate grows. It is also lighter on APM than Dynatrace or Datadog, so app-heavy teams may want a specialist next to it.
Pros
- Fast, automated onboarding.
- Broad hybrid coverage with low maintenance.
- Solid alerting out of the box.
Cons
- Per-resource pricing climbs at scale.
- Less depth on APM than the observability leaders.
- Customization can hit limits, and pricing is quote-based above the list tier.
7. ManageEngine OpManager
Best for: Mid-market teams that want affordable, self-hosted network and server monitoring with a gentle learning curve.
Rating: G2 4.5 out of 5. Gartner Peer Insights 4.5 out of 5.
Pricing: From about $95 per year for 10 devices (Standard, annual). Professional and Enterprise tiers scale up.
OpManager is the value pick. You get solid network performance monitoring, plus server and VM coverage, for a fraction of enterprise pricing, and it is quick to set up. It also sits inside the wider ManageEngine suite, so you can add related tools as you grow.
What you give up is depth. Its AIOps and correlation are lighter than the leaders, some advanced features need paid add-ons, and the interface looks dated to some teams. On very large estates, it does not scale as smoothly as the enterprise platforms.
Pros
- Very cost-effective.
- Quick to deploy, with strong network monitoring.
- Backed by the broad ManageEngine ecosystem.
Cons
- AIOps and correlation are lighter than the leaders.
- Advanced capabilities need paid add-ons.
- Interface feels dated, and it scales less smoothly to very large estates.
8. SolarWinds Hybrid Cloud Observability
Best for: Network-centric IT teams that want deep, multi-vendor network and server monitoring across hybrid environments.
Rating: G2 4.3 out of 5. Gartner Peer Insights 4.4 out of 5.
Pricing: From about $8 per node per month, self-hosted and billed annually. The SaaS Observability tier is priced separately.
SolarWinds has a long history in network monitoring, going back to its Orion product, now sold as Hybrid Cloud Observability.
Its out-of-the-box network visibility across multi-vendor devices is a real strength. The newer SaaS Observability tier adds AIOps for teams that want it.
The module and licensing structure can get complex, and the on-prem product is heavy on resources at scale. Most of the observability lives in the SaaS tier, so an on-prem-only team gets less of it.
Pros
- Strong out-of-the-box network visibility.
- Mature, multi-vendor device coverage.
- Flexible on-prem or SaaS deployment.
Cons
- Module and licensing complexity.
- On-prem can be resource-heavy.
- The newer SaaS tier is where most of the AIOps lives.
9. New Relic
Best for: DevOps and engineering teams that want unified telemetry (APM, infrastructure, logs) on a usage-based model.
Rating: G2 4.4 out of 5. Gartner Peer Insights 4.6 out of 5.
Pricing: Free tier with 100 GB per month and one full user. Beyond that, $0.40 per GB ingested, plus per-user pricing (full users $99 per month).
New Relic rebuilt its pricing around data and seats, so you pay for what you send in and who logs in. Its NRQL queries run across every signal, from APM to infrastructure to logs.
The free tier is generous enough for a small team to run real workloads. For workloads that rise and fall, the usage model can fit well.
Usage-based billing has two sides. It scales down nicely when traffic is low, but it can spike when traffic jumps, and full-platform seats get expensive for large teams. It is also SaaS only.
Pros
- Generous free tier.
- Unified telemetry with one query language.
- Usage model suits variable workloads.
Cons
- Usage-based bills can spike without warning.
- Full-platform seats get costly for large teams.
- SaaS only, with an NRQL learning curve.
10. BMC Helix Operations Management
Best for: Large enterprises that need AIOps-driven event correlation and service monitoring across complex, legacy-plus-hybrid estates.
Rating: G2 3.9 out of 5. Gartner Peer Insights 4.6 out of 5.
Pricing: Quote-based, enterprise. No public list price.
BMC Helix Operations Management leads with AIOps. It uses ML event correlation, causal analysis, and service-centric monitoring, and it holds up where old and new infrastructure sit side by side.
For a large enterprise running both mainframe-era systems and cloud-native ones, that reach matters.
It brings enterprise complexity and cost, and it pays off most inside the wider BMC Helix suite. Setup takes time, and smaller teams rarely have it on their radar.
Pros
- Strong AIOps and event correlation.
- Handles complex legacy-plus-hybrid estates.
- Part of the broader BMC Helix suite.
Cons
- Enterprise complexity and cost.
- Best value only with the wider BMC ecosystem.
- Steeper implementation, and less known among smaller teams.
What Should You Look for in an ITOM Tool?
Before you shortlist anything, weigh a tool against these eight criteria. They separate a real ITOM platform from a single-domain monitor with a broad marketing page.
1. Breadth of Coverage
Does it watch network, servers, cloud, apps, logs, and flows, or just one of them? Consolidation is the whole reason ITOM exists, so a tool that covers one slice leaves you buying three more. If you already run several point tools, count how many a single platform could replace.
2. AIOps and Noise Reduction
Good AIOps turns an alert flood into a short list of real incidents. Look for anomaly detection, event correlation, and root-cause analysis that actually cut the noise. If you are new to the term, it is crucial to understand what AIOps is, where it helps and where it is oversold.
3. Deployment Flexibility and Data Sovereignty
SaaS is simplest, but not every team can use it. Regulated, air-gapped, and data-residency-bound estates need on-prem or hybrid options. Check the deployment model before the feature list, because the best features are useless if the tool cannot run where your data has to live.
4. Automation and Remediation
Detection is only half the job. The tool should hand off to incident management, trigger runbooks, and fix known issues on its own, so a problem gets solved before it turns into an outage. When evaluating a tool, evaluate what it does after it finds a problem, not just how well it finds one.
5. Discovery and Dependency Mapping
You cannot monitor what you have not found. Auto-discovery and a live topology or CMDB show you what depends on what, so you can see what a failure will hit before it happens. CMDB-led and monitoring-led tools differ most here, so match the strength to your specific scenario.
6. Integrations and Standards
Every environment is a mix of vendors and clouds. Out-of-the-box integrations and OpenTelemetry support mean you are not hand-building connectors for months. The more open standards a tool supports, the less you are tied to one vendor's roadmap.
7. Scalability
A tool that shines on 200 devices can buckle at 20,000. Check how it behaves across thousands of devices and multiple sites, and whether the price scales with you or punishes you for growing. Ask existing customers at your size, not just the sales team.
8. Total Cost Behavior
The sticker price rarely tells the real story. Ingest-based and per-module models can sprawl fast as data and hosts grow, so model the bill at two or three times your current scale before you commit. A predictable bill is worth a lot when budgets get reviewed.
Which ITOM Tool Is Right for Your Team?
The best tool depends on your environment, your scale, and how you need to deploy. Here is a quick guide by situation.
Your situation | Start with | Why |
Hybrid or on-prem estate; want network, server, cloud, log, and flow in one AIOps view; regulated | Motadata ObserveOps | Unified triangulation, built-in AIOps, and on-prem, HA, and DR deployment |
Large enterprise standardized on one ITSM platform; need CMDB and service mapping | An enterprise ITOM-plus-CMDB suite tied to your ITSM | A single system of record puts ITOM and ticketing in one workflow |
Cloud-native and microservices; want automatic root cause | An AI-driven full-stack observability platform | Automatic topology and deterministic root cause at cloud scale |
Mid-market, cost-conscious, mostly network and server monitoring | An affordable self-hosted infrastructure monitor | Solid coverage without enterprise pricing or complexity |
Strong DevOps team, variable cloud workloads | A usage-priced SaaS observability tool | Pay for data and seats, with one query language across signals |
If your estate is hybrid or on-prem and you are tired of paying several vendors to watch different corners of it, ObserveOps is the one to weigh first.
You can see how its unified network management system pulls those separate corners into one console before you commit.
Pick the Best ITOM Tool for Your Business
The right IT operations management tools come down to one question: do you want one domain covered well, or the whole stack unified under a single view?
Cloud-native teams can win with a best-of-breed observability tool. Enterprises on a single ITSM platform lean toward a CMDB-led suite.
No single tool wins every dimension, and that is worth saying plainly. Splunk goes deeper on log analytics, Dynatrace automates root cause further, and Datadog carries more cloud integrations.
The trade-off is that a stack of specialists costs more to buy, run, and reconcile than one platform that does the core jobs together.
If you are tired of stitching point tools into one picture, especially in hybrid, on-prem, or regulated setups, ObserveOps brings monitoring, AI-capability, and automation into a single platform, so less of your day goes to jumping between tools.
To see it against your own infrastructure, you can start a free ObserveOps trial and run a real incident through it with your team.
FAQs
Can ITOM tools monitor both cloud and on-premises infrastructure?
Yes, but coverage varies. Some tools are SaaS only and assume a cloud-first estate, while others support on-prem, private cloud, and air-gapped setups for regulated environments. Check the deployment model before the feature list. Motadata ObserveOps offers six deployment modes, including on-prem, high availability, and disaster recovery.
How much do IT operations management tools cost?
Pricing follows a few models: per host or device, per gigabyte ingested, per user, or a custom quote. Per-device pricing is predictable but climbs; ingest-based pricing can swing hard. Motadata ObserveOps is quote-based and bundles monitoring, correlation, and automation into one platform, so you are not paying per module.
Can an ITOM platform track SLAs and SLOs?
Yes, and stronger platforms treat service-level tracking as built-in, not a bolt-on report. You set objectives for availability and performance, then watch them against live data to catch a near-breach early. Motadata ObserveOps includes SLO tracking, correction profiles for maintenance windows, and penalty profiles that model a breach's cost.
Do I still need an ITOM tool if I already have an ITSM platform?
Usually yes, because they do different jobs. ITSM manages tickets, requests, and change, but it does not tell you whether your servers, network, and apps are healthy. ITOM watches the infrastructure and feeds events in. Motadata pairs ObserveOps for ITOM with ServiceOps for ITSM, and they integrate natively.
Author
Ramya Shah
Technical Writer
Ramya Shah is a technical content writer with a computer engineering background and roots in automotive journalism. He covers IT Service Management, observability, IT operations, and AI-driven automation. An early adopter of AI-assisted writing workflows, he turns complex IT processes into clear, engaging content optimized for search and answer engines (AEO), lifting content output and organic visibility.