All Features
Network Observability
LAN Monitoring
Monitor switches, VLANs, and LAN topology with Motadata ObserveOps. Discover devices over SNMP, track port performance, and receive severity-based alerts.
LAN monitoring is the continuous tracking of the switches, routers, VLANs and links inside a local area network to catch faults, congestion and topology changes. Motadata ObserveOps is LAN monitoring software that discovers your devices over SNMP, maps how they connect, and alerts you when a port, VLAN or switch goes wrong.
What Is LAN Monitoring?
Most LANs mix vendors. Cisco core switches may sit beside Juniper or Dell access switches, HPE Aruba edge switches and a few older models nobody wants to replace. LAN network monitoring polls every one of them the same way, so you see device health, port status, VLAN membership and traffic in one place, whatever the brand.
Unlike WAN monitoring, which watches the links between sites and their providers, LAN monitoring stays inside a site, where most problems are a failed port, a loop, a misplaced VLAN or a saturated uplink.
Discover LAN Devices over SNMP
ObserveOps finds LAN devices with two profiles. A credential profile holds the SNMP v1/v2c community string or the SNMP v3 user and security settings. A discovery profile tells ObserveOps what to scan: a single IP or host, an IP range, a CIDR block or a CSV file of addresses.
Discovery runs over UDP port 161, and interface discovery is on by default, so every port on a switch is added along with the device.
ObserveOps reads each device's metrics from the OIDs that its MIBs define and turns them into ready KPIs. Built-in integrations cover switches from Cisco, Juniper, Dell and Extreme Networks, as well as HPE Aruba, Huawei, D-Link, Netgear, MikroTik and more.
Each one brings CPU, memory, port, VLAN and hardware sensor metrics, with spanning tree and stack data where the device supports it. For switch-level detail, see network switch monitoring.
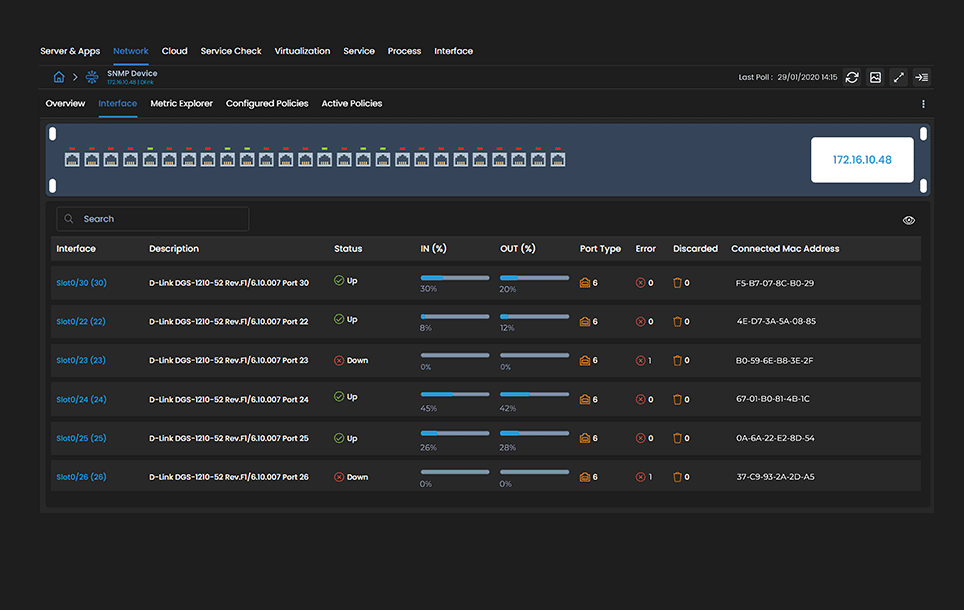
Once a switch is added, its Interface tab shows every port with its status, inbound and outbound utilization, errors, discards and the MAC address connected to it.
Map Layer 2 LAN Topology
The Topology Scanner builds your LAN map from a seed device. It asks that device for its neighbors over CDP, LLDP or switch port mapping, then asks each neighbor for its own, until it has traced every switch interconnection it can reach. Turn on Layer 3 to add routed links over OSPF, BGP or IS-IS, or leave it off to see only the switching layer.
Multiple LAN maps: Each seed device you scan becomes its own map in the topology sidebar, so a campus, a data center and a branch can each have one.
Scheduled scans: Run a scan once, daily, weekly or monthly, so the map keeps up as you add or move switches.
Status on the map: Every node shows the device's current status, so a down switch and the devices behind it stand out at a glance.
Saved views: Filter a map by tag, group, IP or IP range and save it as a named view, such as "Core Switches".
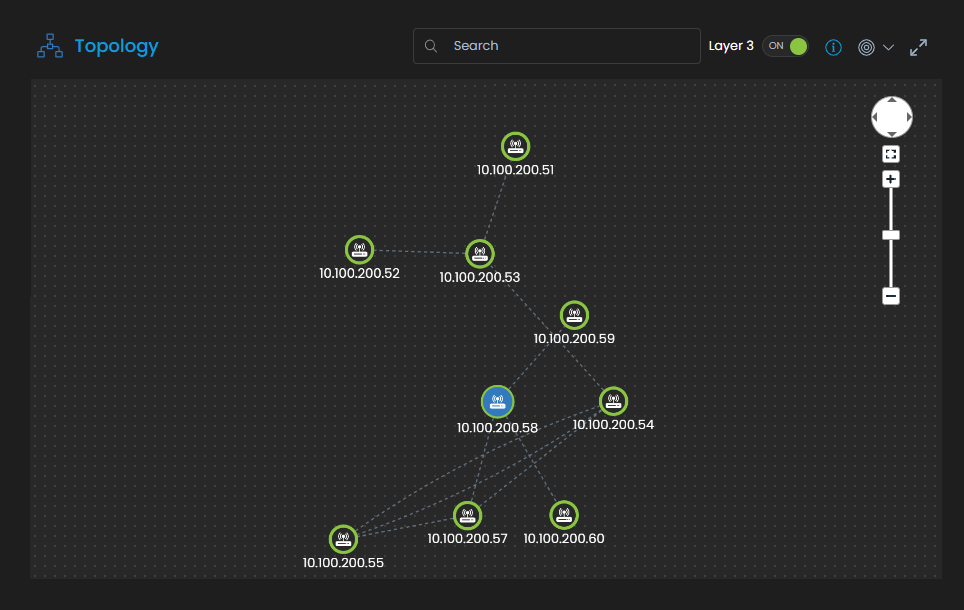
For maps that link applications and services to the devices beneath them, see topology mapping. The LAN topology below shows switches discovered from one seed device, with Layer 3 links turned on.
Monitor VLAN and Interface Traffic
For VLAN monitoring, ObserveOps lists every VLAN on a switch with its name, ID, status and member ports. Each interface also shows its assigned VLAN, so you can follow a VLAN's traffic through the ports that carry it.
Built-in VLAN reports summarize this across switches. If a switch does not expose its VLANs over SNMP, a metric plugin can collect them over SSH instead.
At the port level, ObserveOps tracks status, bandwidth utilization, packets, errors, discards and flaps on every interface. For the full interface metric set, see interface monitoring.
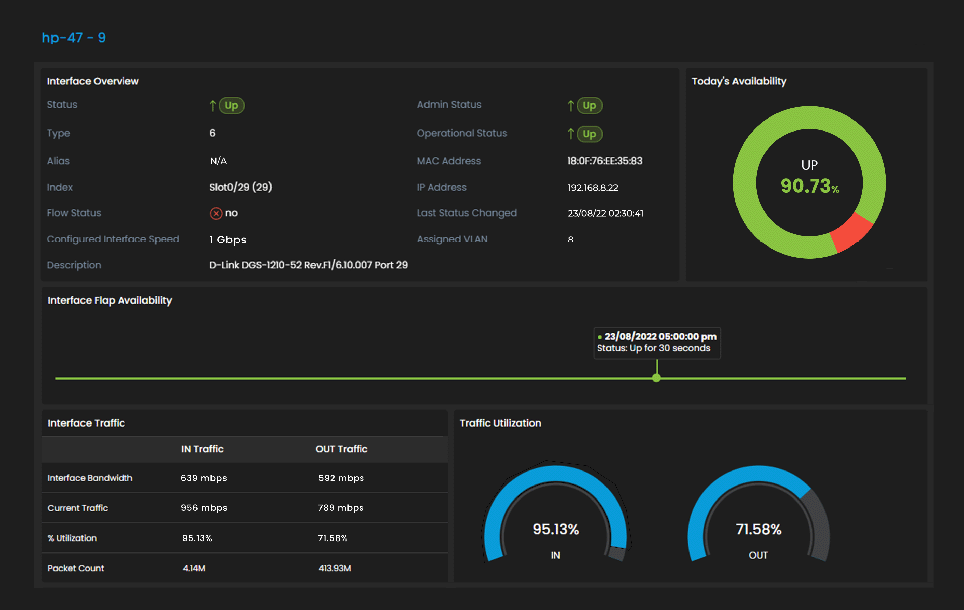
The interface view below shows a switch port with its assigned VLAN, availability, flap history and live traffic utilization.
Alert on LAN Faults by Severity
Each metric policy can hold several thresholds for the same metric, one per severity: Warning, Major and Critical. When a value crosses more than one, ObserveOps raises the alert at the highest severity it meets. You can apply a policy to one device, a group or every monitor.
Route by severity: Send Warning alerts to one team and Critical alerts to another, by email, SMS, Microsoft Teams or Slack.
Act on alerts: Attach a runbook that runs on its own when the alert fires, such as a diagnostic script.
Open tickets: Raise an incident in Motadata ServiceOps at the severity you choose through the ServiceOps integration, or in Jira or ServiceNow.
Keep Every LAN Healthy with Motadata ObserveOps
Motadata ObserveOps discovers the switches and routers on your LAN over SNMP, maps their Layer 2 and Layer 3 links from a seed device, and tracks every port and VLAN. Alerts fire by severity and can open tickets in ServiceOps.
Your LAN sits in the same console as WAN links, flows, logs and traps, as part of network observability. So a failed access port and the traffic it was carrying appear side by side.
Run ObserveOps on premises or in your own cloud, on a single server or in distributed, high availability and disaster recovery setups. Remote collectors can poll the switches at each site, and your monitoring data stays on infrastructure you control.
Ready to implement LAN Monitoring?
Discover how Motadata ObserveOps can help you monitor your infrastructure in real-time and respond to issues instantly.