All Features
Network Observability
Enterprise Network Management
Optimize network performance and perform efficient network operations with proactive monitoring approaches. Get customized rich and detailed dashboards and reports which can help you get complete insights into enterprise operations with Motadata ObserveOps.
Enterprise network management is the monitoring, configuration and governance of large, multi-site, multi-vendor networks from a central platform. For enterprise network monitoring in Motadata ObserveOps, each branch gets its own collector, and everything it gathers lands in one console. The platform keeps running through a server failure, and every user action stays on record.
What Makes Enterprise Network Management Different?
A single office can run on a basic network management system. Stretch that network across a few hundred sites and the job changes in four ways.
Scale: Some of the switches alone carry 48 ports apiece, and a mid-sized company might have hundreds of them on top of its routers and firewalls. One server polling every interface every few minutes will fall behind, which is why the work gets split across collectors.
Vendors: There's rarely just one brand. Cisco at the core, Fortinet at the edge and the HPE switches that came with the last acquisition all need monitoring the same way.
Sites: Branches sit behind WAN links. When one goes quiet, the first question is always the same: is it the link, or something behind it?
Governance: You probably don't want the branch team poking at data center switches. And sooner or later, an auditor will ask who changed a policy last quarter.
Then there's the monitoring platform itself. If it runs on one server in the data center that just lost power, you've lost visibility at the worst possible moment.
Monitor Every Site from One Console
The application and database stay at the head office (or your main data center). Nothing heavy goes out to the branches. A Motadata Collector sits at each site, does the local polling and passes everything up the line. Once it's running, the branch three time zones away is just another group in the dashboard tree.
Choose the collector per site: Pick one in each discovery profile, or leave it blank and ObserveOps will choose. If one collector ends up carrying far more monitors than the rest, Deployment Settings will show it, since it lists each collector's monitor count next to its status and version.
Measure response time from the branch: A URL check run from head office tells you nothing about the branch's experience. Run ping, port, URL or DNS checks from the branch's own collector instead, and the response time you see is the one users there actually get.
Organize by location: Nest groups by region, site and device type, and auto assign new monitors to a group by IP range, type or vendor.
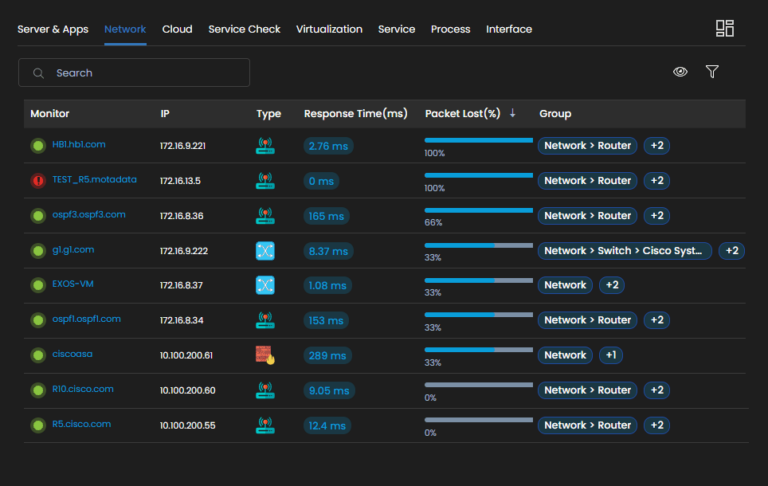
The network view below lists devices across groups with their response time and packet loss, sorted so the worst links show first.
Keep Monitoring Running with HA and DR Deployment
ObserveOps runs on premises or in your own cloud, in the deployment mode that fits your size and uptime needs.
Deployment Mode | How It Works |
Single-box | Application and database on one server or VM |
Distributed | Application and database on separate machines, for security or compliance needs |
Multi-site | Central application and database, with collectors at each remote site |
High availability | Both servers answer on one virtual IP, so nobody has to change a bookmark. Miss enough heartbeats and the primary is written off, with the secondary taking over by itself. |
Disaster recovery | A replica sits at a second site, kept in sync over VPN. It won't promote itself, though. If the main data center is lost, someone on your team starts it as the primary. |
High availability over WAN | Same idea as HA, only the two servers are in different locations. You decide how many missed heartbeats count as a failure, for example three misses at 30 seconds each. |
There's also a small observer server in every HA and DR setup. It copies the configuration and cache every 10 seconds, which means the standby doesn't wake up with last week's settings.
Control Access with RBAC and Audit Trails
Say your Denver office has two network admins who should manage their own switches and nothing else. You'd give them a role with Read and Write on the modules they need (permissions are set per module, and Delete is a separate tick). A user profile then scopes that role to the Denver group or tag, so the rest of the estate simply doesn't appear for them. The central NOC gets a profile scoped to everything.
Directory sign-in: Your admins already have Active Directory accounts, so let them use those. ObserveOps talks to AD over secure LDAP (OpenLDAP too) and re-syncs users on whatever schedule you set. Okta, OneLogin, Azure AD and 1Kosmos cover SSO, and there's RADIUS if you need it.
Password policy: Local ObserveOps passwords follow whatever rules you set, from a minimum length to an expiry date (numbers and special characters can be required too).
Audit reports: Alerts went missing after somebody edited a threshold? Pull the audit report and it'll name the user and show the old value next to the new one. Some teams schedule it monthly for their auditors, while others just export it when asked.
That covers changes made inside ObserveOps. Config changes on the routers and switches are a separate story, covered by network compliance audit trails.
Map Multi-Vendor Topology and Dependencies
Point the Topology Scanner at a core switch and let it crawl. It asks that switch who its neighbors are (over CDP, LLDP or switch port mapping), then asks each neighbor the same thing, and keeps going until it runs out of devices. Flip on Layer 3 if you want routed OSPF, BGP and IS-IS links drawn in as well. Because it's all standard protocols, mixed Cisco and Juniper gear isn't a problem, though vendor-specific metrics still come from the integrations rather than the map. For the switching layer inside a site, see LAN monitoring.
The Dependency Mapper records parent and child relationships between monitors, down to the interfaces that connect them. Most relationships are mapped for you, and you can add the rest by hand. It earns its keep during an outage. If a core switch drops, you can see every device sitting behind it, which tells you their alerts probably share one cause.
Connect Network Alerts to ServiceOps Tickets
Alert policies can open an incident in Motadata ServiceOps when an alert reaches the severity you choose, through the ObserveOps and ServiceOps integration. Different severities can trigger different integration profiles, so Critical alerts become tickets while Warning alerts only notify. Jira and ServiceNow are supported too.
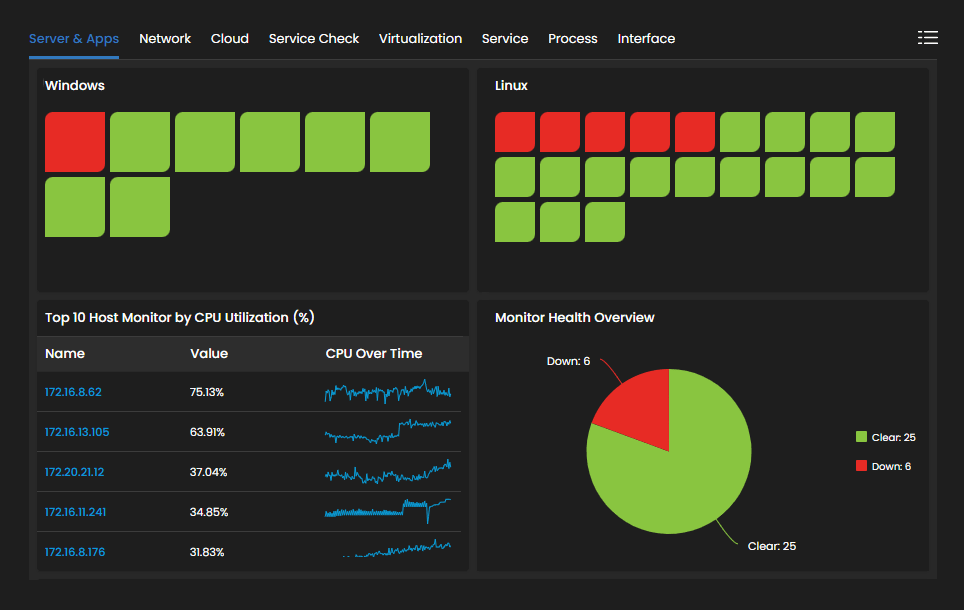
The health overview below shows every monitor as a tile, with down devices in red and the top hosts by CPU beside them.
Run Your Enterprise Network with Motadata ObserveOps
Motadata ObserveOps monitors every site through remote collectors, maps multi-vendor topology and dependencies, and sends alerts to ServiceOps as tickets. Roles, directory sign-in and audit reports keep access controlled and every change on record.
Device metrics, flows, logs and configuration backups sit in one console, as part of network observability. Add network configuration and compliance management to automate changes across devices, and log monitoring to centralize syslog from every site.
Run ObserveOps on premises or in your own cloud, on a single server or in distributed, high availability and disaster recovery setups. Your monitoring data stays on the infrastructure that you control.
Ready to implement Enterprise Network Management?
Discover how Motadata ObserveOps can help you monitor your infrastructure in real-time and respond to issues instantly.