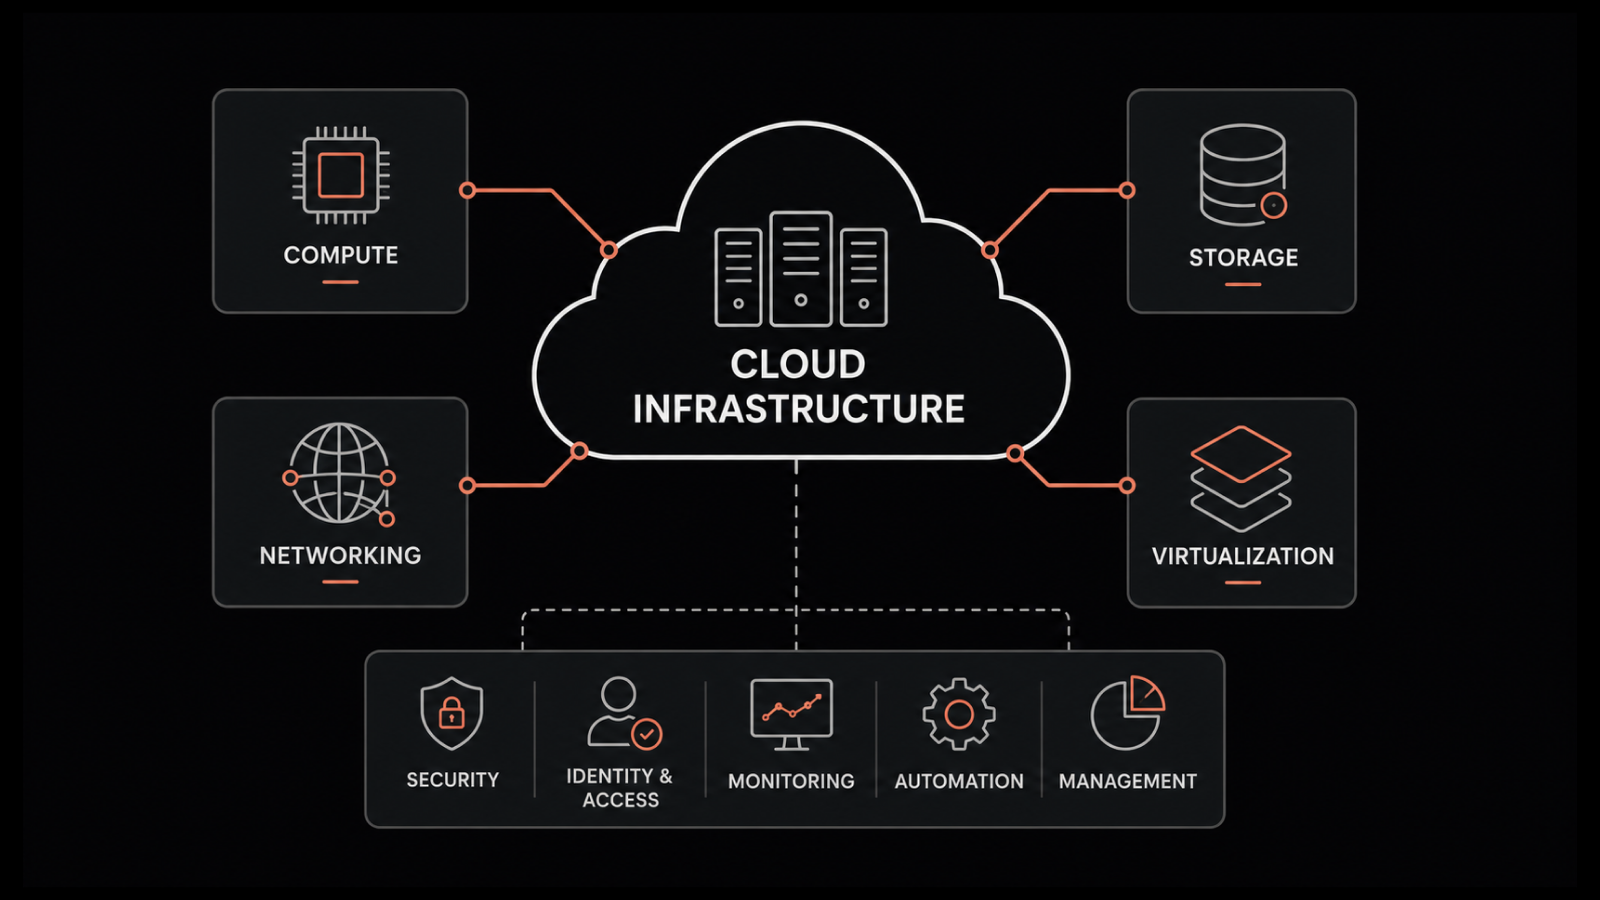
9 Ways to Optimize Cloud Infrastructure with Real-Time Monitoring
Why does your cloud bill climb every quarter while your dashboards report everything as healthy?
An instance provisioned for a launch two years ago still runs at 4% CPU. A storage volume detached during an unfinished migration keeps billing every month. The scaling policy fires ninety seconds after users have already felt the slowdown.
Cloud infrastructure optimization closes that gap by acting on live utilization data instead of a monthly review. The work depends on knowing which numbers matter, what range each one should hold, and what to change when one drifts outside it. Your cloud infrastructure already produces every signal you need.
This guide covers the metrics worth tracking with their healthy ranges, nine methods that move them, and the point where provider-native tooling runs out.
What is Cloud Infrastructure Optimization?
Cloud infrastructure optimization is the practice of matching provisioned cloud resources to actual workload demand, using live utilization data to drive the adjustments. It covers four areas:
Compute sizing: Instance types matched to what the workload actually uses
Scaling behaviour: Policies that add and remove capacity as demand moves
Storage placement: Data held on media matched to how often it gets read
Purchase commitments: Pricing models matched to how predictable a workload is
Cloud optimization is the wider practice this belongs to, covering cost, performance, and reliability across every service you run.
Three outcomes drive the work:
Performance holds steady under changing load
Spending tracks genuine usage
Capacity stays available when demand rises
Optimization runs continuously because cloud environments change continuously. A workload right-sized in January carries a different traffic profile by June, and a scaling policy tuned for last year's peak behaves differently against this year's.
The practice differs from cost management alone. Cost work asks what you are paying for, while optimization asks whether the resource behind that charge is sized correctly for what it does.
Why Cloud Infrastructure Optimization Needs Real-Time Data
Cloud infrastructure optimization needs real-time data because provisioning decisions age faster than review cycles. A monthly cost report tells you what happened. Live utilization tells you what to change today.
Spending pressure makes the gap expensive. Gartner forecasts end-user spending on public cloud services in India to grow 28.1% and total $17.5 billion in 2026, up from $13.7 billion in 2025. Growth at that rate turns small provisioning errors into large recurring charges.
Real-time infrastructure monitoring is the continuous collection and analysis of performance and utilization data as systems run, rather than sampled at intervals. It gives optimization work three things a periodic report cannot:
A current picture of every resource, so decisions reflect today's traffic
An alert on drift, the moment a metric moves outside its expected range
History at full resolution, so you can still see the spike a five-minute average smoothed away
Cloud Infrastructure Metrics to Track and Their Healthy Ranges
The metrics below give you a starting point for cloud infrastructure optimization. Treat each range as a default and tighten it against your own baseline once you have one.
Metric | What it tells you | Healthy range | Action when it breaks |
CPU utilization | Whether compute sizing matches demand | 40% to 70% sustained | Below 40% for a week, size down. Above 85%, scale out |
Memory utilization | Whether the instance has headroom | 50% to 75% sustained | Above 85%, check for a leak before adding capacity |
Network latency at p95 | Delay experienced by the slowest 5% of requests | Under 100 ms service to service | Review placement, routing, and cross-zone traffic |
Disk queue depth | Whether storage keeps up with requests | Under 2 per device | Move the workload to a faster storage tier |
Error rate | Share of requests failing | Under 0.1% of requests | Check saturation, then the most recent deployment |
Response time at p95 | Experience of your slowest users | Inside your published SLO | Trace the slowest path before adding resources |
Scaling lag | Time from threshold breach to capacity arriving | Under your traffic ramp time | Move the trigger to an earlier signal |
The p95 figure means the value that 95% of measurements fall below, which exposes slow outliers that an average hides. Tracking latency this way catches problems that average response times hide.
1. Establish a Performance Baseline Before You Tune Anything
A performance baseline is a record of how your systems behave under normal conditions, gathered before you change anything. Without one, every tuning decision rests on guesswork.
Collect at least two weeks of data so the baseline covers weekday peaks, weekend troughs, and any batch jobs that run on a schedule. For every service you plan to touch, capture:
CPU and memory utilization at their sustained levels
Latency at p95, alongside the average
Error rate as a share of total requests
Throughput in requests per second, at peak and at trough
Store the baseline somewhere the whole team can reach it. Baselines kept in one engineer's spreadsheet stop being useful the moment somebody else needs to justify a resizing decision to finance.
Record the baseline after traffic settles following a migration or launch. Numbers gathered during a cutover reflect the cutover rather than normal operation.
2. Right-Size Instances Against Sustained Utilization
Right-sizing means changing an instance type so its capacity matches the workload's actual demand. It is the single highest-return method on this list because over-provisioned instances bill at full rate whatever they do.
Base the decision on sustained utilization across your baseline period instead of a peak snapshot. An instance touching 90% CPU once a fortnight and holding at 12% the rest of the time needs a scaling policy for the spike, with the baseline size brought down underneath it.
Work through the estate in this order:
Compute instances, where the sheer count of resources gives the fastest return
Databases, which usually hold the biggest single over-provisioning gap because teams size them for a growth curve that has not arrived
Storage volumes, where provisioned IOPS often exceed anything the workload requests
Make one change at a time and watch it for a full traffic cycle before the next. Resizing four services in an afternoon leaves you with no way to attribute a latency change to the change that caused it.
3. Trigger Auto-Scaling on Latency and Saturation Signals
Auto-scaling adds or removes instances automatically as demand changes. The trigger you choose decides whether it helps.
CPU thresholds react late. By the time CPU crosses 70% on a traffic spike, requests are already queuing, and the new instance takes another two to three minutes to accept traffic.
Three signals move earlier and buy back that window:
Request latency at p95, which rises before saturation shows up in CPU
Queue depth, which reflects work waiting instead of work in progress
Concurrent connections, useful where each connection holds resources open
Set minimum and maximum instance counts on every policy. The minimum protects availability during a provider incident, and the maximum stops a traffic anomaly from writing an unbounded bill. Reviewing network capacity alongside these limits keeps scaling within what your links can carry.
4. Reclaim Orphaned Snapshots, Volumes, and Idle Instances
Orphaned resources are provisioned assets no longer attached to anything running. They generate no value and bill at standard rates until somebody removes them.
Four categories account for most of the waste:
Storage volumes detached from terminated instances
Snapshots and backup images older than your retention policy
Load balancers and gateways with no healthy targets behind them
Instances running below 5% CPU for a full month
Run this audit monthly and tag every resource with an owner at creation. Untagged resources are the ones nobody deletes, because nobody knows who would notice. This work overlaps directly with cloud cost optimization, and the two disciplines share the same utilization data.
5. Match Purchase Models to Workload Behaviour
Cloud providers price the same capacity differently depending on the commitment you make. Matching the model to how a workload actually behaves cuts spending without touching performance.
Three models cover most cases:
Reserved or committed capacity suits steady workloads that run continuously and have a predictable floor
Spot or surplus capacity suits interruptible work such as batch processing, test environments, and data analysis, priced well below on-demand
On-demand suits genuinely variable workloads and anything you cannot afford to have reclaimed
Spot capacity can be withdrawn by the provider when demand rises, so route it only to work that can stop and resume safely. Set your reserved commitment against your measured floor rather than your average, because a commitment above actual usage costs more than paying on demand.
6. Tier Storage and Automate Lifecycle Policies
Storage tiering places data on media matched to how often it gets read. Most providers offer three practical tiers:
Hot: Data read daily, held on high-performance storage
Warm or infrequent access: Data read monthly, cheaper to store with a small retrieval charge
Cold or archive: Data read rarely, cheapest to hold with a retrieval delay measured in minutes or hours
Automate the movement between tiers with lifecycle policies instead of scheduling manual reviews. A policy that shifts objects to cold storage after 90 days without a read keeps working after the person who wrote it changes teams.
Start by measuring access frequency across your existing buckets. Most estates carry a long tail of data that has not been read in over a year and is still billing at hot-tier rates.
Set the retrieval expectation before you move anything. Cold tiers charge less to store and more to read, so archiving data your compliance team queries weekly increases the bill.
7. Cut Latency Through Caching and Workload Placement
Latency accumulates across every network hop between a user and your data. Caching and placement both reduce the number of hops that matter.
Cache the content requested repeatedly that changes rarely:
Static assets such as scripts, stylesheets, and fonts
Images and media served to a wide audience
API responses for reference data that updates on a known schedule
Set cache lifetimes against how often the content actually changes. Default expiry values usually leave performance on the table.
Placement matters as much as caching for service-to-service traffic. Cross-zone and cross-region calls add delay on every request, so keep chatty services in the same zone and reserve cross-region traffic for replication and failover.
Map the call path before moving anything. A request that crosses three zones on its way through your stack accumulates delay at every hop, and the fix is usually co-location rather than a larger instance.
8. Tune Alert Thresholds so Genuine Issues Surface
Alert tuning decides whether your team acts on a signal or ignores it. Too many alerts train people to dismiss the channel, and too few let problems run unnoticed.
Set thresholds from your baseline figures. If a service normally holds 65% CPU, an alert at 70% fires constantly and teaches everyone to mute it.
Give every alert a severity tied to a response expectation, then route each level to the channel its owner actually watches:
Critical: Wake the responsible person, a service is affected now
Warning: Review during working hours, a trend is heading the wrong way
Informational: Log it for the capacity review, no response needed
Adding predictive alerting on top of static thresholds catches the drift patterns that never breach a fixed line.
9. Load Test Scaling Policies Before Peak Traffic
Load testing sends controlled synthetic traffic to your environment to see how it responds under pressure. It is the only way to confirm a scaling policy works before customers test it for you.
Test against production-like traffic shapes in place of a flat ramp. A gradual increase tells you very little about how the policy handles the sudden spike that a campaign launch or a news mention produces.
Measure three things during each test:
Trigger point: When the scaling event fires
Arrival time: How long new capacity takes to start accepting traffic
SLO adherence: Whether latency stayed inside your target throughout
Any gap between trigger and arrival is the window your users experience as a slowdown.
Run the test again after every scaling policy change. A threshold adjustment that looks minor on paper can move the trigger point past the ramp your traffic actually produces.
What Falls Outside Your Cloud Provider's Monitoring Console?
Provider-native tools cover their own platform thoroughly and stop at its boundary. AWS CloudWatch reports on AWS resources, and the equivalent services from other providers behave the same way inside their own estates.
Three gaps appear once your environment crosses a boundary:
Multi-cloud views require separate consoles, separate query languages, and manual correlation between them
On-premises resources fall outside provider tooling entirely, so hybrid estates carry a permanent blind spot
Cross-layer correlation between network, infrastructure, and application signals needs full-stack observability that no single provider console offers
Native tools remain worth using for platform-specific depth, and most teams keep them in place. The gap they leave is a single view across everything you run, which is exactly what right-sizing and capacity decisions depend on.
The cost of that gap shows up in the work it creates. Engineers reconcile utilization figures across consoles by hand, capacity reviews stall while somebody assembles the numbers, and decisions get delayed past the point where they would have saved anything.
What Happens if Cloud and On-Premises Capacity Are Sized Separately?
Sizing cloud and on-premises capacity separately produces decisions that look correct on each side and wrong for the workload as a whole. Most teams review the two halves apart because the tooling forces the split. Gartner predicts that 90% of organizations will adopt a hybrid cloud approach through 2027, which makes that split increasingly costly.
Two problems follow:
Wrong sizing choice: A workload flagged for a larger cloud instance may run better on capacity you already own, and an on-premises system near its refresh date may be the cheaper candidate to migrate
Broken attribution: When a service spans a data centre and a cloud region, reporting each half apart leaves you unable to say which side caused a slowdown
Both problems close once utilization from both estates lands on one timeline. Hybrid cloud monitoring that covers only the cloud side keeps the blind spot in place. Teams that keep both estates monitored together size and troubleshoot against the same data.
Optimize Cloud Infrastructure with Motadata ObserveOps
Motadata ObserveOps gives IT teams a single view of cloud and on-premises resources, which is the foundation every method in this guide depends on. It collects utilization, performance, and network data across providers and data centres, then presents them on one timeline.
The platform tracks the metrics in the table above continuously, applies thresholds you set against your own baseline, and surfaces resources drifting outside their expected range. Teams use it to identify over-provisioned instances, spot orphaned storage before it accumulates another month of charges, and confirm that scaling policies fire early enough to protect response times.
Because ObserveOps covers network, infrastructure monitoring, and application layers in one platform, teams correlate a latency spike to its cause without moving between consoles. That correlation is what turns utilization data into an optimization decision you can act on the same day.
For teams running workloads across more than one provider alongside their own data centre, the value comes from coverage. Every resource reports into the same platform, so a capacity review covers the whole estate in one pass.
FAQs
What is cloud infrastructure optimization?
Cloud infrastructure optimization is the practice of matching provisioned cloud resources to actual workload demand. It covers instance sizing, scaling behaviour, storage placement, and purchase commitments, all driven by live utilization data rather than periodic review.
How often should cloud resources be right-sized?
Review compute and database sizing monthly, and run an orphaned resource audit on the same cycle. Any workload with a changed traffic profile deserves a review sooner, particularly after a launch, a migration, or a seasonal peak.
Which metrics matter most for cloud infrastructure optimization?
CPU utilization, memory utilization, p95 latency, error rate, and scaling lag give you the clearest picture. Track them against a baseline gathered over at least two weeks so you know what normal looks like for your own workloads.
Can cloud infrastructure optimization reduce costs without hurting performance?
Yes, because most savings come from capacity nobody is using. Removing orphaned volumes, resizing instances running below 40% CPU, and matching purchase models to workload behaviour all cut spending while leaving performance untouched.
Do native cloud provider tools cover infrastructure optimization?
Provider tools cover their own platform well and stop at its boundary. Multi-cloud environments and hybrid estates need a platform that reports across every provider and every on-premises resource on a single timeline.
Author
Poonam Lalani
Content Strategist
Poonam Lalani is a B2B content strategist and writer with a background in computer engineering and experience across enterprise technology domains, including AI, cloud, DevOps, data engineering, and IT operations. She specializes in creating research-driven content that simplifies complex ideas and supports product education, thought leadership, and business growth.