Grep Command in Linux: Syntax, Flags, and Practical Log Searches
A service failed eighteen minutes ago and the answer is somewhere inside a 400 MB log file. How do you find the four lines that matter?
Faster than any editor or file viewer, the grep command in Linux answers that question. Hand it a pattern and it walks the file line by line, printing whatever matches. During an incident, that single behavior covers most of what an administrator does at a terminal.
Most engineers learn three or four options and stop there. Grep does considerably more once you combine it with pipes, regular expressions, and the log files that a log management pipeline collects from every server.
In this blog, you will see what the command does and how its syntax fits together. From there come the options worth memorizing, how to use grep command in Linux against both files and command output, and the way to write patterns that match precisely. The closing sections put a number on what manual searching costs a team and mark the point where grep alone runs out.
What Is the Grep Command in Linux?
The grep command in Linux is a text search utility. Give it a pattern and it reads the input line by line, printing every line that contains a match, whether the source is a file, a directory, or the output of another command. It ships with every Linux server, so nothing needs installing before you start.
Ask what is grep command in Linux, or simply what is grep, and the answer does not change: a filter that keeps the lines matching your pattern and discards everything else. The name traces back to g/re/p, an instruction in the old ed line editor standing for global regular expression print. Because regular expressions were part of the design from version one, grep handles them without a separate mode.
Three properties make it the default tool for command line searching:
Line oriented: Grep treats a match as a whole line, which maps neatly onto log data where one event occupies one line
Stream friendly: It reads from standard input, so any command that produces text can be filtered through it
Exit code aware: It returns 0 when a match is found and 1 when none is, which makes it usable inside scripts and health checks
The exit code is the property most people miss. Find nothing and grep still returns 1, which lets a script branch on whether the pattern was there without parsing a single line of output.
When Should You Use the Grep Command?
Reach for the grep command whenever the question is "which lines contain this" and the text is reachable from the machine you are already on. Six situations cover most of its daily use:
Finding a known string in a known file: An error message, a hostname, or a transaction ID you already hold
Locating a setting across a config directory: Recursive search beats opening files one at a time to find where a value is defined
Filtering another command's output: Process lists, kernel messages, and unit status all print more than you need
Testing whether something exists inside a script: The exit code answers yes or no without printing a line
Narrowing a log file before analysis: Cutting a million lines down to a few hundred makes the rest of the work possible
Investigating a single host during an incident: The command is already installed, so there is nothing to set up first
Grep stops being the right tool when the question crosses several hosts, depends on named fields rather than raw text, or needs to reach you before you think to ask it. Those three limits get their own section further down.
What Is the Basic Syntax of the Grep Command?
Order matters in the basic syntax of the grep command. Options come first, the search pattern second, and the files to search last.
grep [options] pattern [file...]
Each part does a specific job:
Options: Flags that change matching behavior, such as -i for case insensitive matching or -r for recursive search
Pattern: The string or regular expression you want to find, quoted whenever it contains spaces or special characters
File: One file, several files, a glob, or nothing at all, in which case grep reads standard input
Quote the pattern every time. Before grep receives anything, the shell, usually bash, has already expanded * and $ and split the line on spaces. An unquoted search therefore hunts for something other than what you typed.
What Are the Most Useful Grep Command Options?
Eighteen grep options cover almost every search an administrator runs.
Option | What It Does | Example |
-i | Ignores case when matching | grep -i "error" app.log |
-r | Searches a directory and its subdirectories | grep -r "timeout" /etc/ |
-v | Inverts the match and prints non matching lines | grep -v "200" access.log |
-n | Prefixes each result with its line number | grep -n "failed" auth.log |
-c | Prints the count of matching lines only | grep -c "denied" auth.log |
-w | Matches whole words only | grep -w "user" config.conf |
-l | Prints file names containing a match | grep -rl "api_key" /srv/ |
-o | Prints only the matched portion of the line | grep -o "[0-9]\{3\}" ids.txt |
-E | Enables extended regular expressions | grep -E "error|fail" app.log |
-F | Treats the pattern as a fixed string | grep -F "10.0.0.1" hosts |
-A n | Prints n lines after each match | grep -A 5 "Exception" app.log |
-B n | Prints n lines before each match | grep -B 3 "Exception" app.log |
-C n | Prints n lines around each match | grep -C 4 "panic" kern.log |
-q | Stays quiet and returns only an exit code | grep -q "ok" status.txt |
-L | Prints the names of files with no match | grep -rL "license" /src/ |
-x | Matches only when the whole line matches | grep -x "OK" status.txt |
-m n | Stops reading after n matches | grep -m 5 "error" huge.log |
--color=auto | Highlights the matched text | grep --color=auto "fail" app.log |
Two combinations are worth memorizing. grep -rn searches a directory tree and prints the file name and line number beside every hit, which is how most people search a codebase. grep -ic returns one number, the count of matching lines regardless of capitalization.
The linux grep family also includes three older commands that still turn up in legacy scripts:
egrep: The same as grep -E, using extended regular expressions
fgrep: The same as grep -F, treating the pattern as a fixed string with no special characters
rgrep: The same as grep -r, searching recursively from a starting directory
All three are deprecated in favor of the flags, and some distributions have removed the aliases entirely.
How Do You Use the Grep Command in Linux With Examples?
Each example below pairs one flag with the problem it solves, covering the grep command in Linux with examples for the searches that come up most often.
Search a Single File for a String
The simplest form takes a pattern and a file.
grep "connection refused" /var/log/app/service.log
Making grep case insensitive takes one flag. Use it when several libraries write to the same file and each capitalizes its messages differently.
grep -i "connection refused" /var/log/app/service.log
Search Recursively Across a Directory
When the filename is unknown, a grep recursive search finds which file holds the string.
grep -rn "database_host" /etc/myapp/
Beside every match, -n prints the file name and the line number. Open the file afterwards and you land on the right line rather than searching it twice.
Two more flags control the sweep and the output:
grep -rn --include="*.conf" "listen" /etc/nginx/
grep -rl "deprecated_flag" /opt/services/
Use --include to restrict the search to one file type. Where you only need to locate files rather than read them, -l prints their names and nothing else.
Search for Multiple Patterns at Once
Repeat -e and one pass covers several terms.
grep -e "error" -e "fatal" -e "panic" /var/log/app/service.log
Past a handful of terms, move the patterns into a file of their own and pass it with -f:
grep -f known-errors.txt /var/log/app/service.log
That file turns into a shared list of known failure signatures. The next person runs a single command rather than recalling every pattern from memory.
Invert the Match to Remove Known Noise
Inverted matching removes lines you have already explained so the rest becomes short enough to read.
grep -v "healthcheck" access.log | grep -v " 200 "
On an access log, health checks and successful requests usually outnumber failures by several hundred to one, and removing both leaves a list worth reading. The same technique helps when you categorize logs before analysis.
Count Matches Instead of Printing Them
Rather than the lines themselves, -c returns how many of them matched.
grep -c "500" access.log
A hypothetical case shows why that helps. An engineer counts 14 server errors in yesterday's access log and 1,840 in today's, and knows the rate jumped roughly a hundredfold without opening a dashboard.
Show Context Around a Match
A stack trace spans many lines, so the matching line on its own rarely explains the failure.
grep -A 15 "NullPointerException" application.log
-A prints lines after a match, -B prints lines before it, and -C prints both. Fifteen trailing lines usually covers a Java stack trace, and three leading lines catches the request that triggered it.
Escape Characters That Have a Special Meaning
A dot, an asterisk, and a question mark all mean something to the regular expression engine, so finding them literally takes a backslash.
grep "error\.log" filelist.txt
Without the backslash, error.log also matches errorXlog and error1log. Escaping every character gets tedious, so reach for -F whenever the whole pattern is literal text:
grep -F "10.0.0.1:8080" /var/log/app/service.log
Save the Results to a File
Redirect the output and you keep a record of what you found. That matters once the evidence has to go into a ticket or a postmortem.
grep -n "OutOfMemoryError" application.log > oom-hits.txt
grep -n "OutOfMemoryError" application2.log >> oom-hits.txt
A single > creates the file or overwrites it, while >> appends. For matches on screen and in a file at once, pipe through tee:
grep "Failed password" /var/log/auth.log | tee failed-logins.txt
How Do You Combine Grep With Pipes and Other Commands?
Any command that prints text can be filtered by piping it into grep. Most of grep's daily use looks exactly like this.
The shape stays the same every time. Run a command, pipe its output into grep, keep what you want.
ps aux | grep nginx
dmesg | grep -i "out of memory"
systemctl list-units | grep failed
ls -l /var/log | grep "\.gz$"
There is a catch in the first one. Because the grep process carries the word nginx in its own command line, ps aux | grep nginx matches itself. Two fixes work:
Bracket the first character: ps aux | grep "[n]ginx" matches the running service and skips the grep process
Use pgrep instead: pgrep -a nginx was built for process lookup and avoids the problem entirely
Pairing grep with find narrows the search by file age or name before any reading starts, which helps on a directory holding months of logs:
find /var/log -name "*.log" -mtime -7 -exec grep -l "OutOfMemory" {} +
That reads only the files modified in the last seven days.
Grep can also filter a file while it is being written. Pipe tail -f into grep to watch a live log for one event:
tail -f /var/log/app/service.log | grep --line-buffered "ERROR"
Add --line-buffered. Without it, grep holds output in blocks and releases matches in delayed bursts, so what you see on screen lags behind the file.
How Do You Write Regular Expressions in Grep?
Grep regular expressions start with anchors and character classes, and most searches never need more than those two.
Grep uses Basic Regular Expressions by default. Switch to Extended Regular Expressions with -E. Where BRE demands a backslash before grouping and alternation characters, ERE drops the requirement.
The constructs that cover most work:
^ anchors to the start of a line: grep "^Sep 21" syslog returns entries from that date only
$ anchors to the end of a line: grep "denied$" auth.log matches lines ending in that word
. matches any single character: grep "c.t" words.txt matches cat, cot, and cut
repeats the previous character: grep "abc" file.txt matches ac, abc, and abbbc
[ ] defines a character class: grep "[0-9]" data.txt matches any line containing a digit
| provides alternation under -E: grep -E "error|warn|fatal" app.log matches any of the three
[^ ] negates a character class: grep "[^0-9]" data.txt matches lines containing anything other than a digit
+ and ? set repetition under -E: grep -E "lo+g" file.txt matches log and loooog, and grep -E "colou?r" file.txt matches both spellings
Quantifiers match a set number of characters, which pins down structured text such as an IP address:
grep -E "[0-9]{1,3}\.[0-9]{1,3}\.[0-9]{1,3}\.[0-9]{1,3}" access.log
The -P flag enables Perl compatible expressions such as lookarounds, but several distributions ship a grep built without it, so scripts relying on -P fail there.
Instead of the whole line, -o prints only the matched text, which makes grep a simple extraction tool feeding sort and uniq. Text with named fields is better handled by a log parser, which does the same job without a pattern that breaks every time the format changes.
How Do You Use Grep to Search Linux Log Files?
Grep does its most useful work on log files, because a log records one event per line and grep matches one line at a time.
Most of the files you will search live in /var/log. Debian and Ubuntu write general messages to syslog and authentication events to auth.log, while Red Hat uses messages and secure.
Systemd is the exception. Its journal is stored in a binary format grep cannot read, so pipe it out with journalctl first:
journalctl -u nginx --since "1 hour ago" | grep -i "error"
Authentication failures are the common starting point in the plain text files:
grep "Failed password" /var/log/auth.log
Ranking the source addresses behind those failures takes one pipeline:
grep "Failed password" /var/log/auth.log | awk '{print $(NF-3)}' | sort | uniq -c | sort -rn | head
Narrowing to a time window uses the timestamp already printed at the start of each line:
grep "Sep 21 10:" /var/log/syslog
Three habits separate a useful search from a frustrating one when you grep log files on a busy host:
Search compressed archives with zgrep: Log rotation leaves older files as .gz archives, and zgrep "error" /var/log/syslog.*.gz reads them without unpacking anything, while bzgrep does the same for .bz2 archives
Search several files at once: grep -H "timeout" /var/log/app/*.log prints the file name beside each match, which keeps multi file output readable
Filter before you count: Strip known noise with -v first, then count what remains, otherwise the total includes traffic you already explained
Structured formats are where this breaks down. JSON logs and syslog messages carry named fields, and grep has no concept of a field, so a search for 500 matches a status code, a byte count, and a user ID equally. Searching by field requires parsing the line first, which is what structured logging pipelines do.
What Does Manual Log Searching Cost an IT Team?
Manual log searching costs an IT team in four ways, and each one grows with the number of servers rather than with the difficulty of the question.
Each one compounds as the server count grows:
Engineer hours: One question asked across forty hosts becomes forty searches, so the time spent tracks the size of the deployment
Outage duration: Every minute spent locating evidence is a minute the service stays down, which is why work to shorten MTTR targets investigation before it targets repair
Audit preparation: Regulators and customers ask for audit logs covering months, and archives already deleted by rotation cannot be produced at any price
Key person dependency: The pipelines that find answers fast are memorized by one or two senior engineers, so response slows whenever those people are on leave
A hypothetical case puts numbers on it. A team of six runs a hundred Linux hosts and handles twelve incidents a month. If two engineers spend forty minutes each locating evidence in every incident, that is sixteen hours a month before any repair begins, with nothing recorded that the next person can reuse.
The question for a decision maker is whether that figure grows with next year's server count. Searching from the command line costs about the same per host every time, so the total rises in step with the infrastructure.
Where Does the Grep Command Stop Working at Scale?
The grep command stops working at scale because it searches one host, one set of files, and one moment, while an incident usually spans all three.
Five limits appear in roughly this order as an environment grows:
One host per search: A question covering forty servers means forty SSH sessions, or a loop that runs slowly and leaves no record of what was checked
Rotation and retention: Files rotate, compress, and are eventually deleted, so without a log retention policy the evidence may be gone before anyone asks for it
No field structure: Grep matches text, so a search for a status code also returns byte counts and identifiers containing the same three digits
No correlation: A database timeout, an application error, and a load balancer retry are one event recorded in three files, and grep cannot join them
No alerting: Grep answers only the questions you thought to ask, so nothing surfaces until a person already suspects a problem
The fifth limit costs the most. An outage nobody notices for forty minutes has already run for forty minutes before the first search is typed.
A collection pipeline removes all five limits by gathering logs centrally, parsing them into fields, and holding them for a period the business sets. Most teams reach that point somewhere between ten and fifty hosts, usually just after an incident nobody could reconstruct afterward.
Logs answer only part of the question on their own, which is why observability treats them as one signal beside metrics, traces, and topology. Correlation is where the difference shows. Once events from different sources share a timestamp and a set of fields, a question that took an afternoon across several terminals is answered by one query.
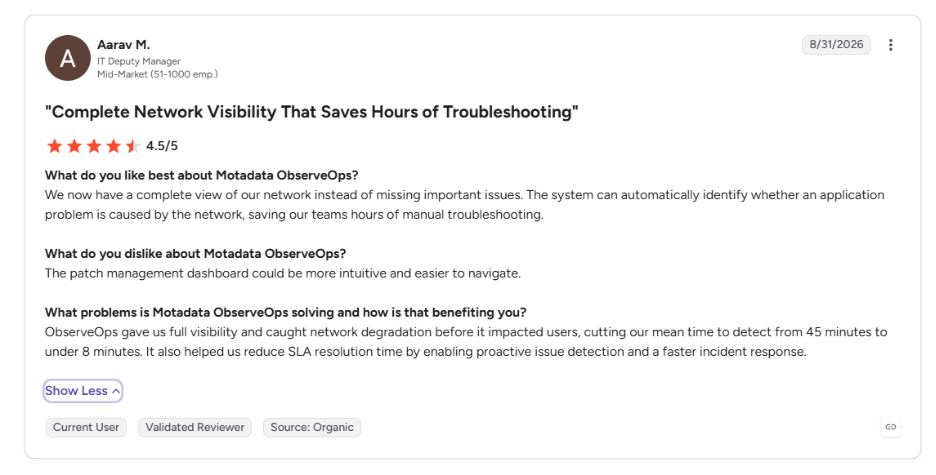
This is what one of our customers says about Motadata ObserveOps on G2:
Move From Single Host Searches to Unified Log Observability With Motadata ObserveOps
No observability platform removes the need for grep. On a single server, with one file and a question you can already phrase, grep is still the fastest answer available. The difficulty is the number of servers you have to repeat it on.
Motadata ObserveOps collects logs from Linux, Windows, network devices, and applications into one pipeline, parses them into searchable fields, and retains them for a period you set. Full text and field level queries run across every source at once, so a question that meant forty SSH sessions becomes one search. Pattern detection flags anomaly bursts nobody thought to look for, and log to metric conversion turns repeated events into a trend line a manager can read.
ObserveOps ties those logs to metrics, traces, and topology in one view, which is what centralized logging is for. Teams that move from terminal searches to log search across the whole deployment usually see investigation time fall first, then the number of incidents that ever reach a customer.
Keep grep for the question you can answer on one server. Use a pipeline for every question that crosses more than one.
FAQs
What does the grep command do in Linux?
Grep reads text line by line and prints every line matching the pattern you give it. Administrators use it most often to find errors in log files, locate a setting across configuration directories, and filter the output of other commands.
What does grep stand for?
The grep full form is global regular expression print, taken from the ed editor instruction g/re/p. The name describes the behavior accurately, since the command applies a regular expression across every line of input and prints what matches.
How do I make grep case insensitive?
Add the -i flag before the pattern, as in grep -i "error" app.log. One pass then matches error, Error, and ERROR, which helps when several components write to the same file and capitalize differently.
How do I use the grep command in Linux to search every file in a folder?
Run grep -r "pattern" /path/to/directory to search every file in that folder and its subfolders. Adding -n prints line numbers, and --include="*.log" restricts the search to one file type.
Can grep search logs across multiple servers?
Grep reads files only on the machine where you run it, so covering several servers means repeating the command on each one. Platforms such as Motadata ObserveOps collect logs from every host into one indexed store, so a single query covers the whole infrastructure.
Author
Poonam Lalani
Content Strategist
Poonam Lalani is a B2B content strategist and writer with a background in computer engineering and experience across enterprise technology domains, including AI, cloud, DevOps, data engineering, and IT operations. She specializes in creating research-driven content that simplifies complex ideas and supports product education, thought leadership, and business growth.