All Features
Network Observability
Network Anomaly Detection
Spot unusual behavior on network devices, traffic, logs and flows before it reaches your users. Motadata ObserveOps runs AI and ML baselining on each network metric it monitors and raises an alert once a live value leaves its expected range.
What Is Network Anomaly Detection?
Network anomaly detection flags network behavior that breaks from its own history. The signals are the ones you already watch: device CPU, interface traffic, response times and error rates. When one of them moves outside its learned pattern, you hear about it early, while the problem is still small.
An anomaly can point to a performance issue or a security event:
Performance issue: A link, interface or device starts behaving differently from its own history, often well before it fails outright.
Passive attack: An intruder quietly reads and copies sensitive data.
Active attack: An attacker goes further and modifies, encrypts or deletes that data.
Either kind of attack shows up in network activity long before the damage is plain on a dashboard.
What Is Network Behavior Anomaly Detection?
Network behavior anomaly detection (NBAD) looks at the network itself over time. It knows how much traffic a device or link normally carries, and which hosts usually talk to each other and when. So if that pattern shifts and stays that way, NBAD marks it for investigation.
Why Static Thresholds Miss Network Anomalies
Of all the anomaly detection methods, static thresholds are the simplest. They also miss network anomalies, since an alert fires only once a value crosses a fixed number. Anything unusual that stays under the limit an admin set on a critical metric goes unreported.
That approach catches outright failures and little else. These patterns typically pass through unnoticed:
A slow drift in bandwidth use
A traffic pattern that shifts at an unusual hour
An error rate climbing steadily below the ceiling
ObserveOps takes a different route and learns what to expect from each metric's own history. That way, the reference point keeps pace with how the network runs today. A wide enough gap between a live value and its learned range triggers the alert, which is what proactive network monitoring looks like in practice.
How Motadata ObserveOps Detects Network Anomalies
Motadata ObserveOps uses AI anomaly detection to spot network anomalies, checking every new data point against a baseline. Each monitored metric gets its own baseline, a learned picture of how it normally behaves over hours, days and weeks. Values outside that learned range become candidates for an alert.
1. Metric, Log and Flow Data in One Policy
The ObserveOps anomaly policy works on network metrics, log data and flow data from the same engine. You create it under the metric, log or flow policy type, so device health, traffic behavior and application response all follow one policy model.
Each policy can apply at three levels:
Monitor: One specific device or instance.
Group: Every monitor in a group, each evaluated on its own.
Everywhere: Every monitor in the system that carries the selected metric.
2. Baselining Algorithms: Basic and Agile
ObserveOps offers two algorithms for analyzing pattern behavior in your metrics: Basic and Agile. You pick one per metric, set a deviation value, and the platform draws the expected band from there.
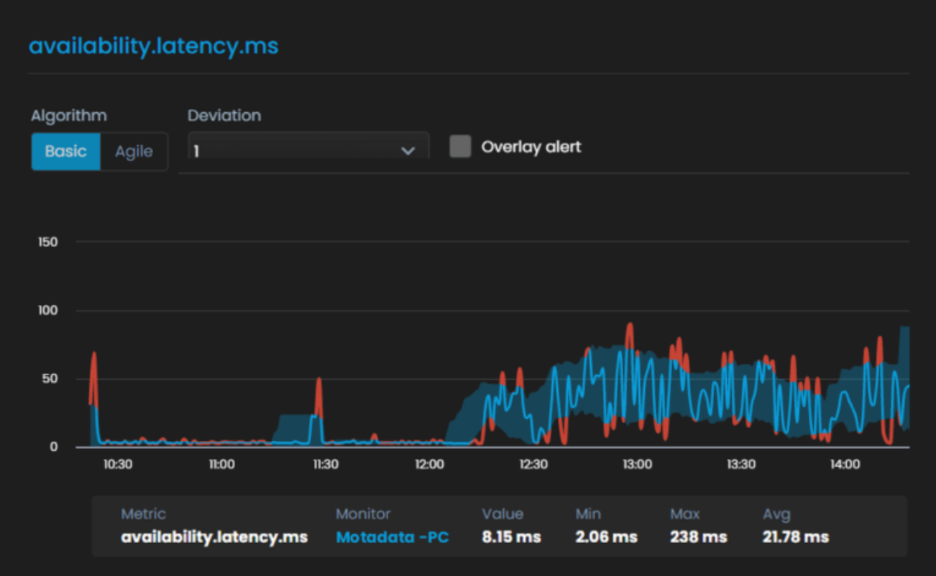
With Basic, you set an acceptable deviation range, and anything that falls outside it gets flagged. The chart makes this easy to read: the shaded area is the expected band, and values that break out of it turn red.
Agile is the other option here, built on a different model but fed by the same history. Switching between the two on one chart shows which band fits the metric better before detection goes live.
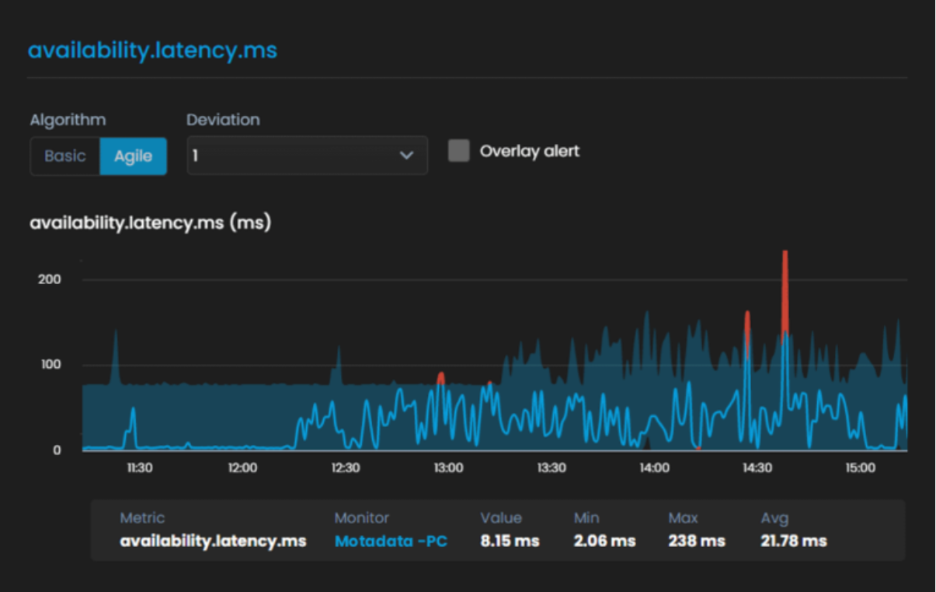
Pick the algorithm first, before detection is switched on. It helps to know the use case, and what kind of network operation the metric reflects. From there, ObserveOps checks each polled value against the pattern it has learned for that metric.
For metrics with strong daily or weekly cycles, the metric policy also offers a Baseline Alert. Here the alert goes off when a value leaves its usual range for that time of day and weekday. Deviation can be set in absolute values or as a relative percentage.
3. Polling Data Required Before Detection Starts
An anomaly policy needs history before it can do anything useful: at least eight hours of polling data per metric. With that much data, the alert engine can set a baseline and decide what range counts as acceptable.
Every half hour, the engine rolls all polling values into one sample point. A sample that lands outside the acceptable range counts as anomalous, and it can raise an alert once the policy's other conditions are also met.
4. Sample Lookup and Evaluation Frequency
Sample Lookup decides how many recent samples the policy looks at each time it evaluates. With a value of 30, the policy weighs the last 30 samples. AI and ML policy evaluation runs every 15 minutes, which keeps this close to real-time network anomaly detection.
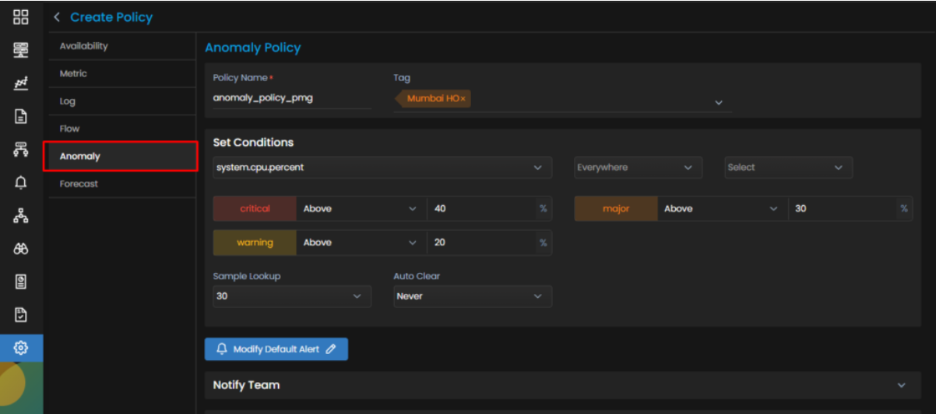
You build this on the Create Policy screen. There you pick the metric and give each severity its percentage band. Sample Lookup and Auto Clear follow, with Auto Clear setting how long an alert can stay open before it clears automatically, whatever the other conditions.
 Metrics with strong trends and repeating patterns suit anomaly policies best. Those are also the metrics where threshold alerting has the hardest time.
5. Notifications and Runbook Actions
When an anomaly policy breaches, ObserveOps routes the alert and can act on it. The same policy screen covers:
Notifications: Email and SMS to registered users, any email address, or a Microsoft Teams channel, with different recipients per severity.
Forwarding: Alerts sent on to an external destination through a Syslog Forwarder or SNMP Trap Forwarder profile.
Renotification: Repeat alerts at a set interval while severity stays unchanged, with an option to stop once someone acknowledges the alert.
Runbooks: A runbook that executes when the alert triggers, with separate actions for the alert state and the clear state.
How Severity Is Calculated: A Worked Example
Severity depends on how many samples in the lookup window come back anomalous. Each severity gets a percentage band that you define, and at every evaluation ObserveOps checks the count against those bands.
The four examples below all use the same policy. Sample Lookup is set to 10, critical fires above 40% of samples, major above 30% and warning above 20%.
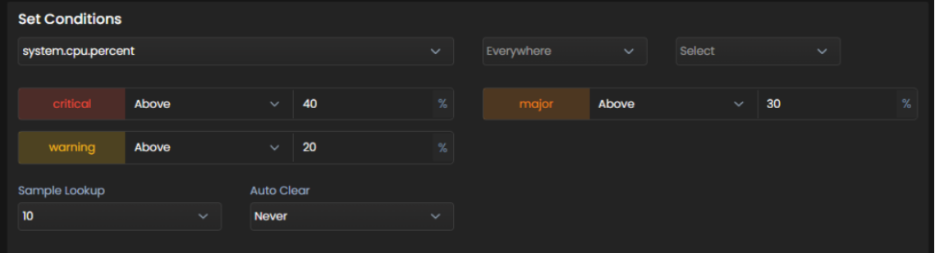 Against a lookup of 10 samples, those percentages work out to a straight count:
Critical: 5 or more of the last 10 samples are anomalous.
Major: 4 of the last 10 samples are anomalous.
Warning: 3 of the last 10 samples are anomalous.
No alert: Fewer than 3 samples are anomalous.
Bands like these keep small swings out of the critical queue, and that is one practical way to cut alert noise.
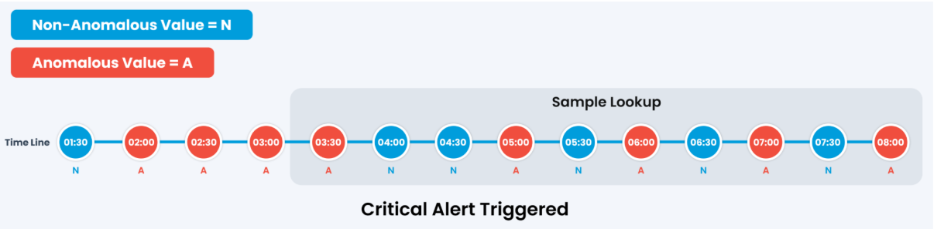
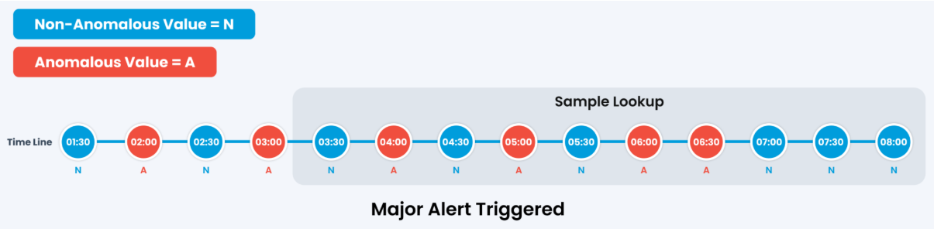
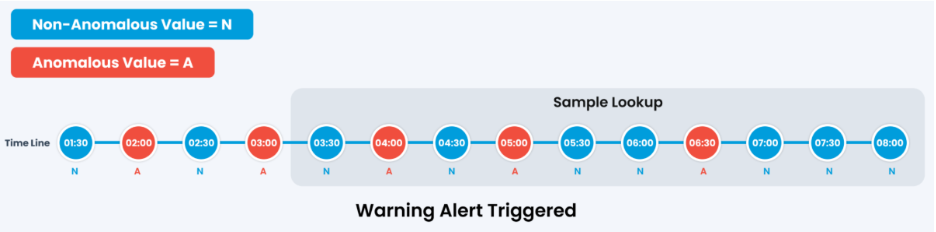
In the timelines below, N is a normal sample and A is an anomalous one. The shaded band is the Sample Lookup window the policy evaluates.
Example 1: Critical Alert
Five of the ten samples in the lookup window come back anomalous. That crosses the 40% band, so ObserveOps raises the alert at critical severity.
Example 2: Major Alert
Four of the ten samples come back anomalous. That clears the 30% band without reaching 40%, so the alert is raised at major severity.
Example 3: Warning Alert
Three of the ten samples come back anomalous. That clears the 20% band only, so the alert is raised at warning severity.
Example 4: No Alert
Only one sample in the lookup window comes back anomalous. The count stays under every configured band, so nothing reaches the alert queue.
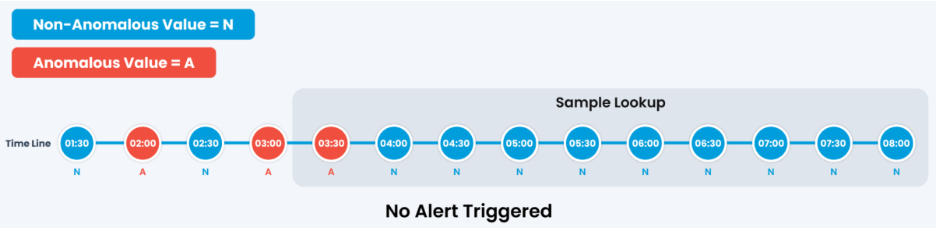
This is what keeps a one-off spike from paging anyone. Until a pattern shows across the window, the policy holds off on deciding that anything is wrong.
Where Network Anomaly Detection Helps Most
Network anomaly detection pays off most on metrics whose shape shifts across the day or week. On those, a single fixed limit ends up too tight at some hours and too loose at others. The table below maps common network signals to what a learned baseline catches.
Signal | What a Learned Baseline Catches |
Interface and link utilization | Gradual bandwidth growth and traffic anomalies that stay under the utilization limit |
Device CPU and memory | Resource use climbing outside its usual range for that time of day |
Response time and latency | Slowdowns that break a device's or link's normal pattern before users report them |
Error and discard rates | Steady increases that stay below any fixed ceiling |
Flow volumes and conversations | Traffic between hosts, ports or protocols that departs from its learned volume |
Log event volumes | Unusual spikes or drops in log counts from a device or application |
The same signals matter for anomaly detection in network security. When traffic or log activity breaks pattern, it shows up beside performance issues. Network and security staff then share one starting point for an investigation.
Predictive Analysis for Network Capacity and Performance
Predictive analysis works from historical network data, using statistical models to estimate where a metric goes next. Anomaly detection covers the present; forecasting covers the weeks ahead and what your links and devices will need by then.
ObserveOps applies the same learned history to network capacity planning through its forecast policy:
History required: At least 24 hours of data for the metric.
Trigger: The forecast value moves above or below a limit you set.
Window: The forecast range you choose for the evaluation.
Forecasts show interfaces heading toward saturation and devices running short on resources, which leaves time to add bandwidth before network congestion builds. The change then goes ahead as planned work during business hours. Longer horizons are covered too, with capacity planning across compute, storage and network resources in ObserveOps.
What Network Anomaly Detection Changes for Your Team
With network anomaly detection, you find out sooner that something has gone wrong. Alerts are based on what the platform has learned about each metric. So problems show up early, while they are still small.
Earlier detection: Deviations show up before end users report them.
Fewer blind spots: Metrics with daily and weekly cycles get watched across the whole cycle.
Quieter alert queues: Severity bands keep minor variations out of critical.
Faster root cause work: Anomalous metrics narrow where to look during an investigation.
Planned capacity: Forecasts show where bandwidth and device resources will run short.
Security signal: Traffic that breaks pattern gets flagged alongside performance issues.
Catch Network Anomalies Early with Motadata ObserveOps
Static thresholds remain useful for hard limits like device availability. Slow drifts and off-pattern behavior call for something else, and network anomaly detection catches what a fixed number misses.
Inside Motadata ObserveOps, anomaly detection is one part of a full network monitoring solution, with detection, correlation and response on the same platform. Metric, log and flow data run through one policy model, and forecasts reuse that history for capacity planning.
Ready to implement Network Anomaly Detection?
Discover how Motadata ObserveOps can help you monitor your infrastructure in real-time and respond to issues instantly.