All Features
Network Observability
Network Performance Management
We built Motadata ObserveOps for the moment a branch office calls about a slow ERP screen. The router metrics, flow records, traps, syslog and configuration history needed to answer that call are all in one console.
What Is Network Performance Management?
Network performance management is the day-to-day job of measuring a network and fixing whatever slows it down. Applications depend on that job being done well.
Every order, payment and video call crosses the network. Good network performance management catches a congested WAN link or a struggling switch while the service desk queue is still quiet. In practice, it covers five activities:
Measure: Latency, packet loss, jitter and bandwidth for every link; CPU and memory for every device
Baseline: Weekday peaks and weekend lulls each get their own normal range
Alert: Flag a threshold breach, a drift from baseline or a forecast problem before users report it
Diagnose: Trace each slowdown to its source (a device, an interface, a hop or a recent configuration change)
Optimize and report: Apply the fix and plan capacity. Then show leadership how the network performed last quarter
Our network performance monitoring page covers the first three in detail. Management adds the last two, and that is where lasting fixes come from. One console for all five is what to look for first in network performance management tools, and ObserveOps provides it.
Why Does Network Performance Management Matter to the Business?
Sales calls break up, support queues grow and month-end reports run late when the network slows. Network performance management guards against that, and finance gets a documented reason behind each upgrade.
Higher uptime: A link that is degrading, but still up, triggers a baseline or forecast alert
Faster resolution: Fewer screens to check. Metrics, path data, device events and configuration history are in one place
Planned spending: Upgrade the links that need it; capacity reports also show which ones still have room
Better user experience: Video calls stay clear and checkout pages load on time
Which Network Performance Metrics Drive Management Decisions?
Network performance metrics become management data when each reading leads to a decision. Take utilization: a WAN link that peaks near capacity every month end is a case for next year's budget.
Seven signals come up most often. Each row gives the usual cause and the action that tends to follow.
Signal | What It Usually Points To | Management Action |
Sustained high utilization on a link | More users or a new application on the same link | Order more bandwidth or move backups to a quieter path |
Rising interface errors and discards | Bad cabling or a duplex mismatch; sometimes full buffers | Replace hardware, correct port settings or rebalance traffic |
Latency or packet loss rising on a single WAN path | One congested hop, frequently inside the carrier network | Pinpoint the hop, then take the path data to the carrier |
Jitter above its normal range | Unstable delay on voice and video paths | Check QoS marking (the priority tag on voice packets) and the route calls take |
CPU or memory running near its limit | A router, switch or firewall short of headroom | Redistribute load or schedule a hardware refresh |
One application dominating a link | Bulk transfers or one busy host taking the bandwidth | Move large transfers off-peak or apply a traffic policy |
Availability dropping again and again | A flapping device, an unstable link or a power issue | Check the flap summary report, then fix the recurring fault |
Combine signals before acting. High latency with clean interface counters suggests a path problem; rising discards on a single port suggest local congestion.
How Does Motadata ObserveOps Collect Network Performance Data?
Six data sources feed Motadata ObserveOps: SNMP polling, ICMP ping checks, flow records, SNMP traps, syslog, and SSH or vendor APIs. We store and analyze all of it in one console.
Two of these are active. Polling and ping checks go out and ask each device for data; flow records, traps and syslog are passive and arrive when the device sends them. Most capacity and hardware decisions need at least two of them.
SNMP and native protocols: Per-device CPU, memory and interface counters come in through SNMP monitoring, SSH and vendor APIs. This is the evidence behind most capacity and hardware decisions
Flow data: Each NetFlow, sFlow, jFlow or IPFIX record is a short summary of one conversation, exported by a router or switch. If backup traffic fills the WAN link at month end, flow analytics names the hosts and applications responsible
Traps and syslog: A link that flaps between two polls, or a failed admin login, still gets recorded; the device sends a trap (its own alert) or a syslog message the moment it happens
Monitor Network Device Health
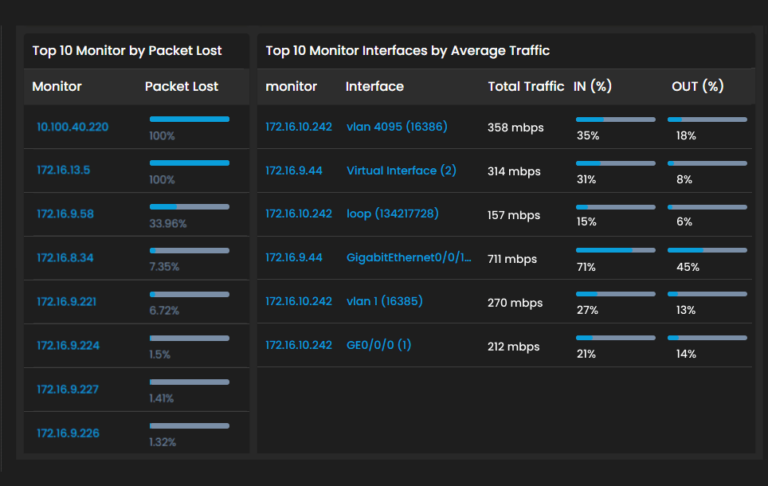
Device health monitoring watches availability, CPU, memory and interface load on each router, switch, firewall and server. An overloaded device usually shows strain here before it drops traffic.
A core router can run at full CPU and still answer every ping, while voice calls through it break up. ObserveOps keeps packet loss, CPU and memory trends side by side for each device, and that kind of strain becomes visible on one screen. Below is the device health overview, with availability and resource usage for each monitored device.
Diagnose Network Performance Issues Faster
Diagnosing a network performance issue starts with what users report and ends at a specific device, interface or hop. A slow login page, for instance, might trace back to one overloaded firewall.
ObserveOps gives network operations center (NOC) engineers several ways to do that from the same console. Our network troubleshooting guide covers the wider method.
Ping and traceroute: Traceroute runs from whichever ObserveOps collector (the polling server) is closest to the branch. Our documentation walks through one case: hops 1 to 4 answer in under 5 ms, hop 5 takes 280 ms, and that hop turns out to be the ISP handoff. The engineer opens a ticket with the carrier
Hop-by-hop path monitoring: NetRoute keeps a separate latency, packet loss and availability record for each hop. Route changes are flagged, and the path history stays available for post-incident review (more under network path visibility)
Topology context: Layer 2 and Layer 3 maps, built from neighbor discovery protocols (CDP, LLDP) and routing protocols (OSPF, BGP, IS-IS), with a health color on every node; the map shows which upstream device a struggling segment depends on
Trap and syslog alerts: A fan failure or interface flap reported by the device can raise an alert through a trap or log policy as soon as the message arrives, next to the performance data for that device
Set Network Alert Policies That Match Business Priority
Every alert policy in ObserveOps starts with three choices. You pick the condition, the severity and the devices it covers. Set them well and the core of the network gets the closest watch.
The Set Conditions screen lists four alert types. Threshold is the simplest (a fixed limit, such as CPU above 80%). Baseline learns the norm for each hour and day, Anomaly uses AI-based anomaly detection, and Forecast warns before a limit is reached.
Scope: We let you aim a policy at one monitor, a group, a tag, or Everywhere (the Source Filter setting). Give each site its own tag and branch alerts stay separate from data center ones
Severity levels: Set Warning, Major and Critical conditions per policy, so a core WAN link and a lab switch can carry different limits
Noise control: Fire an alert only after a set number of consecutive breaches within an evaluation window, and let it clear automatically
Response: Notify people by email, Microsoft Teams or Slack, run a runbook (a scripted fix) when the alert fires, or open an incident in Motadata ServiceOps through an integration profile
Manage Network Configurations to Protect Performance
Network configuration management keeps a dated copy of every device configuration. So when an overnight change slows a site, the last saved version is one restore away.
A single access list edit can slow a whole site. We built the NCCM module (Network Configuration and Compliance Management) for that problem. It backs up configurations on a schedule and, after a failed change, a security incident or data loss, restores a known-good version.
Scheduled backups: Running configuration, startup configuration, or both; weekly, monthly or on chosen dates. A copy can go to an external SFTP or FTP server too
Version-based restore: Restore a single device to any saved version, or restore many devices at once to their baseline or latest configuration
Approval control: Restores requested by users with only the NCCM role wait for sign-off from a user with the NCCM Approval role
Templates and runbooks: Device templates and runbook automation keep backup and change commands consistent across device types
Report on Network Performance and Capacity
Network performance reports and dashboards turn collected data into views people can act on. They show trends, prove availability and back up capacity decisions.
More than 150 reports come built in. Top 25 Monitors by CPU Utilization is a good place to start (it ranks last week's busiest devices). For the rest, we let you build custom reports on downtime, CPU, memory or bandwidth and email them on a schedule as PDF, XLSX or HTML.
Network Performance Reports
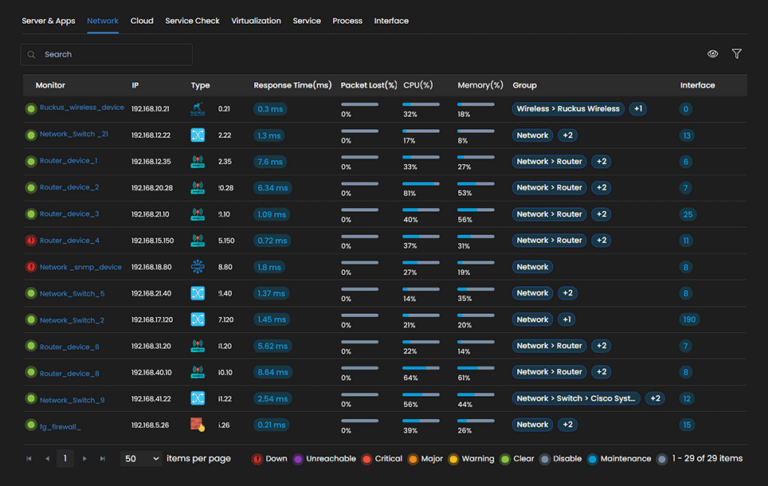
Capacity forecasting and historical trend reports show which links and devices are approaching their limits, which feeds straight into capacity planning. The device usage report below is one example of how these views appear.
Network Performance Dashboards
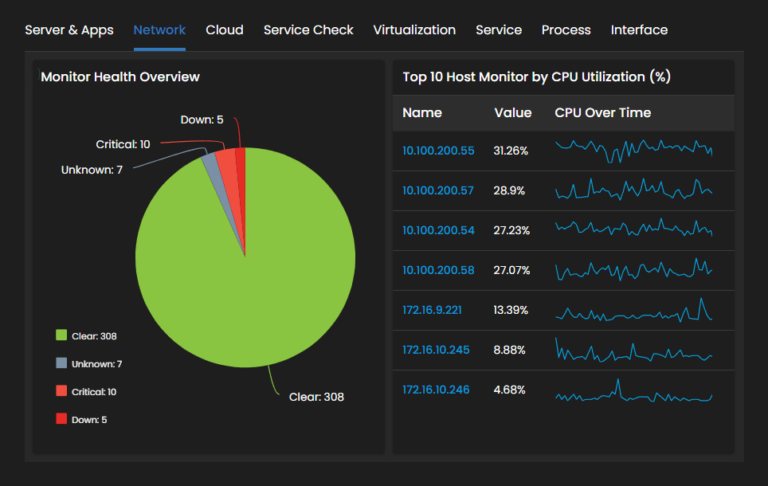
Custom network dashboards show device health, performance and active alerts through widgets you choose. Add threshold alerts to the same view, and the network admin hears about an error as soon as a threshold is crossed. The dashboard below is one example.
How to Build a Network Performance Management Strategy
A network performance management strategy defines what you measure, what normal looks like and how IT responds. With one in place, performance work follows a plan you can repeat.
Three obstacles come up in most networks: tools split by vendor or domain, alert thresholds set without a baseline, and capacity decided on guesswork. Five steps address them:
Discover and group every device: Routers, switches, firewalls, servers and links, all in one inventory and grouped by site and business service
Baseline before you set thresholds: Collect enough history for alerts to reflect normal behavior for each device and time of day
Prioritize business-critical paths: Watch the WAN links and segments behind customer-facing services most closely
Tie configuration control to performance: Back up configurations before every change so a degrading change can be reversed quickly
Review trends on a schedule: A quarterly look at capacity and availability reports shows which links need an upgrade next
Availability per site is the first number to track. Add the time it takes to resolve network incidents and the count of links above their planned utilization, and the quarterly review has its scorecard.
For more ways to raise throughput and cut delay, see these network performance strategies.
Manage Network Performance End to End with Motadata ObserveOps
Network performance has many moving parts. Devices, links, paths, traffic and configurations each tell part of the story, and with a separate tool for each one, engineers spend much of an outage matching evidence across screens.
Some problems still need hardware; when demand outgrows a link, the fix is more bandwidth. ObserveOps is network performance management software that gives earlier warning, a clear route from symptom to cause and versioned configurations to fall back on, which makes network performance optimization a routine task in one console.
Ready to implement Network Performance Management?
Discover how Motadata ObserveOps can help you monitor your infrastructure in real-time and respond to issues instantly.