All Features
Network Observability
Network Management Dashboard
Transform the monitored metrics data into actionable intelligence information at a centralized dashboard for the enterprise. Get complete visibility into network operations with live Motadata alerts and showcase the overall health of network devices and services.
It is essential to analyze the data and get rich information from data to make confident and required actions. Motadata ObserveOps offers customized and insightful network management dashboards that help identify network issues, making network admin’s tasks easy.
Motadata ObserveOps is a comprehensive network management solution that transforms monitored metrics data into actionable intelligence information at a centralized console for the enterprise. In addition, the IT admins can customize the dashboards as per their requirements and scale them to meet IT management needs.
Dashboards for Network Administration
Addressing issues immediately and displaying real-time data on dashboards to trace the metrics
Customized widgets to keep a close eye on prioritized and crucial metrics. Export the metrics in visualization formats such as pie, graph, bar, grid, sankey, etc.
Keeping a close eye on active or triggered alerts in a specific timeline on the dashboard, ensuring good health of the network devices.
Get default dashboards for your specific or tailor-made use cases such as business overview, infrastructure overview, and particular monitoring category.
Get an out-of-box dashboard for each technology stack, providing an eagle-eye view of critical aspects of the infrastructure.
Network Management Dashboard with Motadata ObserveOps
Motadata ObserveOps offers unique and out-of-the-box dashboards with various measured metrics. It represents the metrics from the entire network architecture from the monitored network services, devices, and metrics.
Here are some of the examples:
Top Network Monitor by Latency
Top Network Monitor by CPU Utilization
Top Network Monitor by Memory Usage
Top Network Monitor by Downtime
Top Interface by Traffic Utilization
Top Interface by Error Packets
Top Wireless AP by Clients
Top Wireless Clients by Traffic bytes
Top Wireless by Wlan Traffic
Top Wireless Client by Signal Strength
Top Wireless Client by Connection Retries
Customizable Dashboards
You can customize the dashboard for the respective technology stack for your business needs. Let’s say you wish to prepare an overview dashboard for the network environment, you can use Motdata ObserveOps custom widget creation functionality.
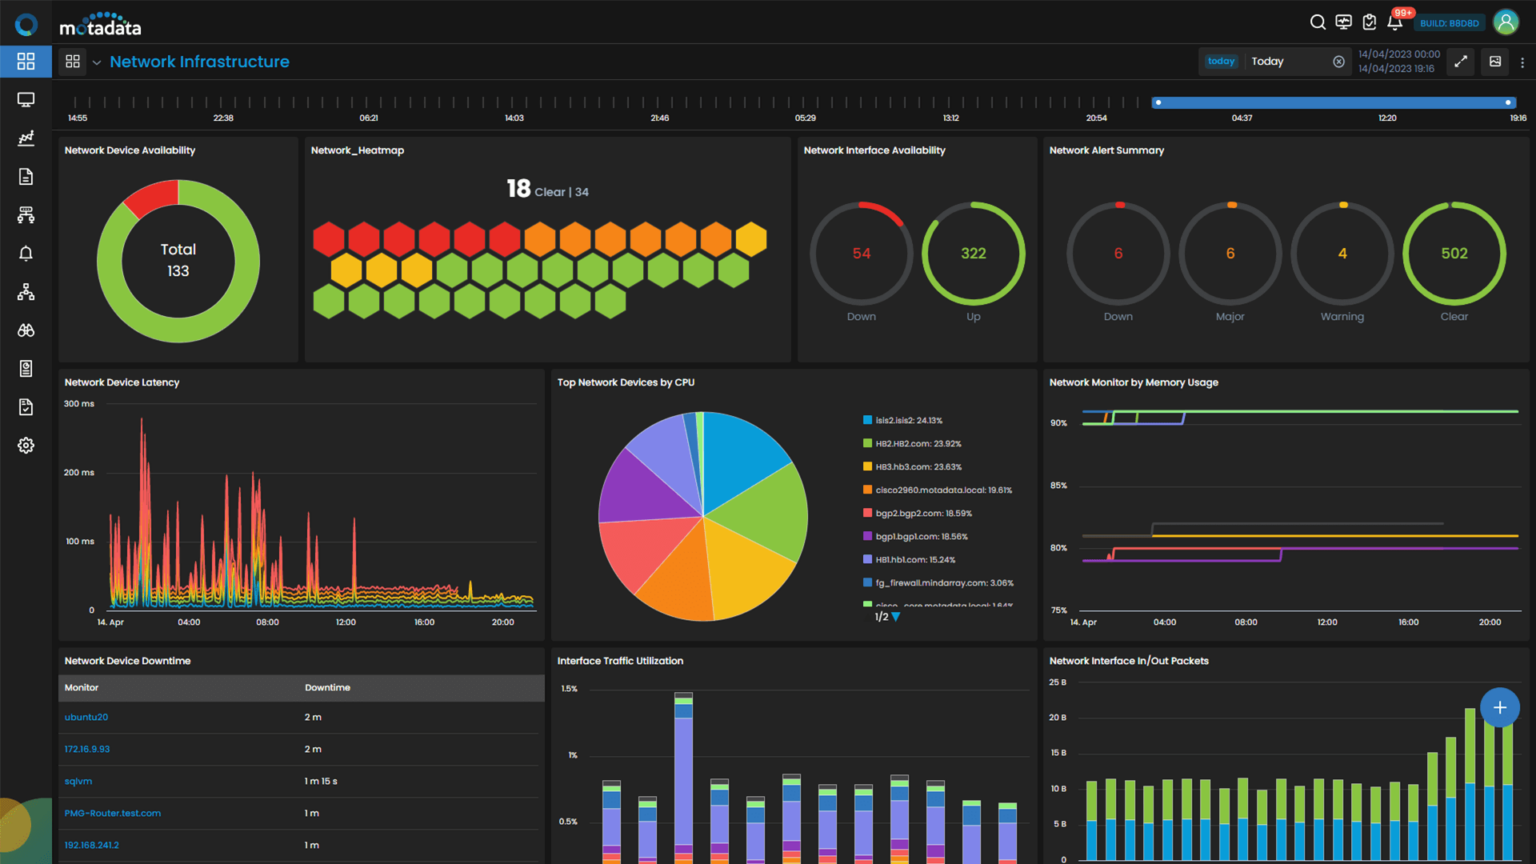
Overall, you can create widgets for critical devices, high usage CPU utilization devices, traffic utilization devices and more, which get displayed on a unified dashboard.
ALERT SUMMARY DASHBOARD
Motadata ObserveOps offers you a particular Network Management Dashboard dedicated to showcase the live issue and alerts going on across the network. You can view the critical alerts priority-wise and take actions according to the criticalness.
Get complete visibility into network operations by live Motadata alerts, showcasing the overall health of network devices and services.
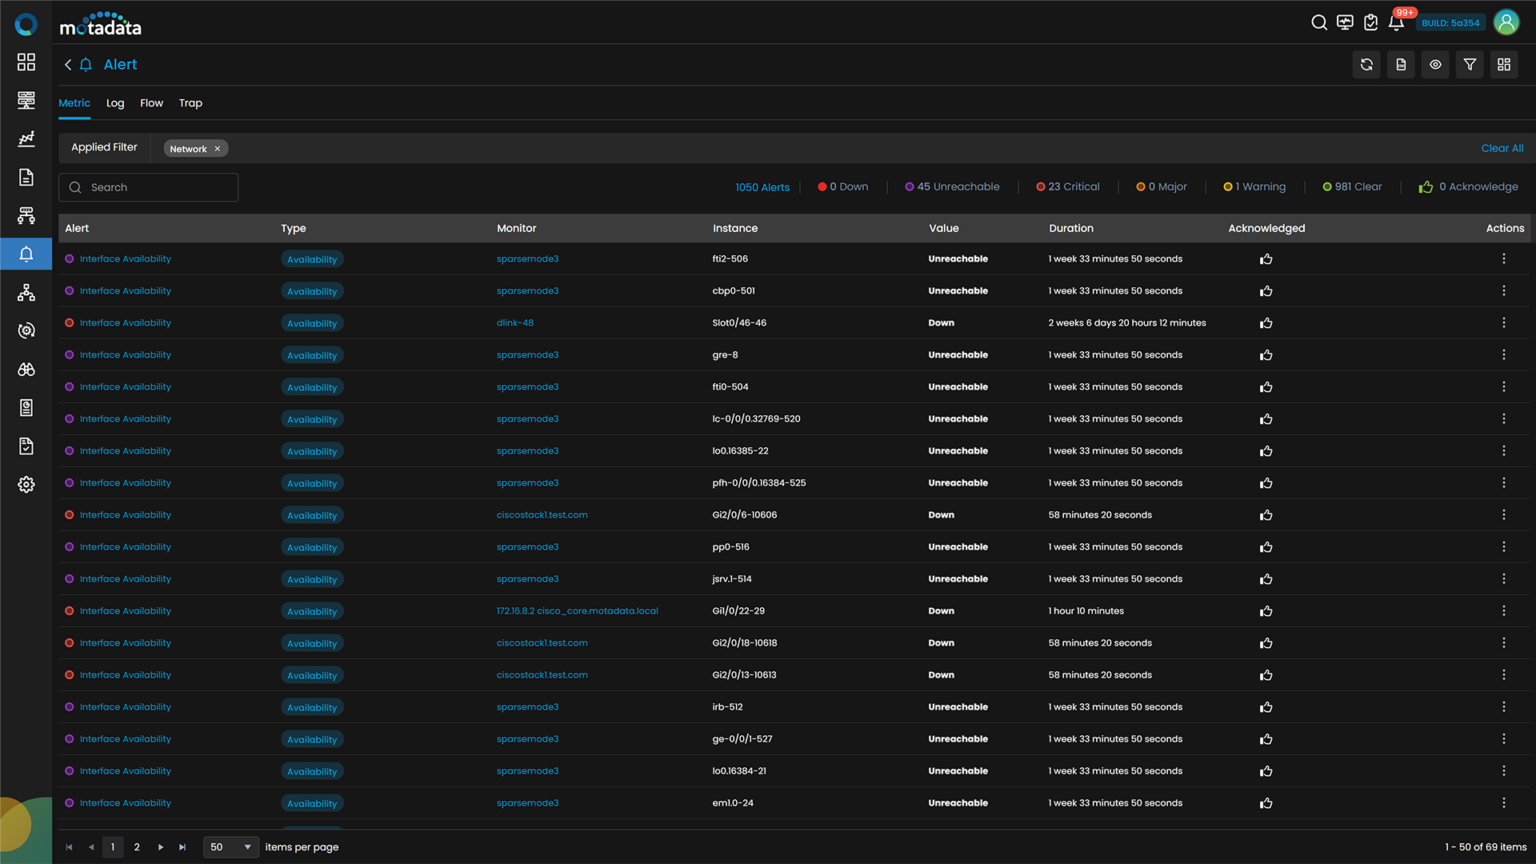
You can add custom widgets and KPIs as per your preferences and priorities, helping you make confident decisions and enhance your network’s performance. In addition, the AI-ML abilities predict the potential alerts and showcase them on dashboards, helping you resolve the issues before they cause any damage.
Ready to implement Network Management Dashboard?
Discover how Motadata ObserveOps can help you monitor your infrastructure in real-time and respond to issues instantly.