8 Best Honeycomb Alternatives in 2026 (Compared & Ranked)
If Honeycomb no longer gives you the visibility you need across your IT environment, it may be time to look at other options.
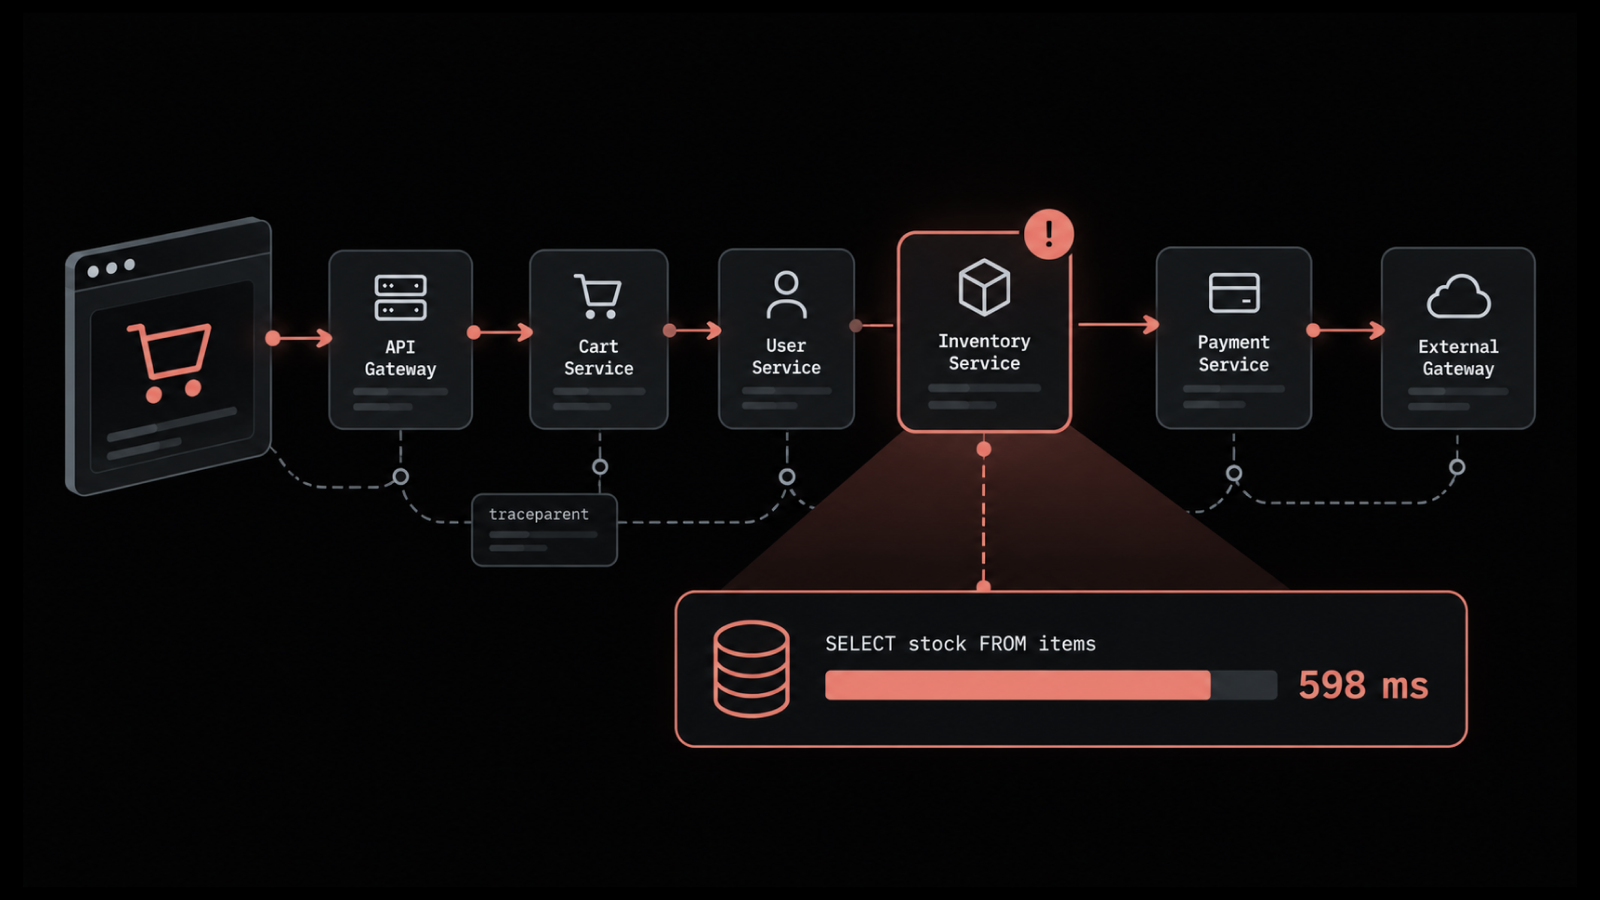
Honeycomb is built around tracing and works well for digging into live application data. But it does not cover servers, network devices, or databases, and its cloud-only setup may not work for every team.
Pricing can also be a reason to compare alternatives. Honeycomb charges based on the number of events you send, so costs depend on how much data your applications generate.
We've put together 8 Honeycomb alternatives to help you compare what they offer, what they cost, and where each one may fit.
Why Teams Look for a Honeycomb Alternative
These are the reasons users give most often on review sites and in engineering forums when they explain why they moved.
Event-based pricing is hard to predict: You pay for the events you send. A traffic spike or a release that adds fields to every trace can raise the bill without anyone changing a setting. You can read more about Honeycomb pricing covers how the tiers work.
The free tier is small for production: The free plan covers a limited monthly event count. A single busy service can use it up in days.
No infrastructure monitoring: Honeycomb does not monitor servers, switches, or databases. Most users pay for a second tool to cover those.
Log search is lighter than rivals: Honeycomb handles structured events well. If you need general log monitoring across systems that do not emit traces, other tools do more.
Cloud-only: There is no self-hosted version. If your rules say data cannot leave your network, Honeycomb is out. Our guide on on-premises versus SaaS covers that choice.
The query model takes time to learn: Honeycomb asks you to think in events and attributes rather than dashboards. Engineers who like that approach stay with it, and the rest spend their first month adjusting.
Sampling adds work: Keeping costs down usually means sampling your traces, and setting up sampling rules correctly is a job in itself.
How We Compared These Honeycomb Alternatives
We compared every tool against the same set of questions, so the entries stay comparable.
Signal coverage: Does it handle traces, metrics, and logs, or only some of them?
Infrastructure monitoring: Can it monitor servers, databases, and network hardware as well as applications?
Deployment: Can you run it on your own hardware, or only in the vendor's cloud?
Pricing model: Is it billed by event, by data volume, by host, by user, or by usage hours?
Open standards: Does it take OpenTelemetry data without a vendor's own agent?
Setup effort: How long does it take to get the first service reporting?
Support and community: Is help included, and how active is the user base?
8 Best Honeycomb Alternatives in 2026
1. Motadata ObserveOps
Best For: IT operations groups that need application data, infrastructure, and logs under one license.
Motadata ObserveOps is a unified observability platform that covers application performance, infrastructure monitoring, and log analysis in one product.
We've placed this platform first for three reasons:
Coverage: It monitors servers, network devices, databases, and applications. Honeycomb covers the application layer only, so most of its users buy a second tool.
Deployment options: On-premises, private cloud, or hosted. Honeycomb is cloud-only.
Pricing model: Cost is based on the devices you monitor and the logs you keep, not the number of events your services emit.
This matters when traffic spikes and your event volume goes up. With event-based pricing, costs can rise simply because your applications are generating more data, even if you're monitoring the same number of devices.
Motadata ObserveOps also helps reduce the number of alerts your team has to deal with.
If a database slows down, causing application timeouts and errors in the logs, those related alerts can be brought together as one incident instead of showing up separately.
That gives your team a clearer place to start investigating.
Pricing is not publicly available, so you'll need to contact the sales team for a quote.
Pros
- One license covers application data, infrastructure, and logs, so there is no second bill to plan for.
- Cost does not move when your traffic spikes.
- Runs on your own hardware, which keeps it in the running where cloud-only tools are rejected.
- Support is included rather than sold as a higher tier.
- Free trial and guided demo before any commitment.
Cons
- No public price list, so budgeting needs a sales conversation first.
- Tracing is not as detailed as a tool built only for tracing.
- Smaller user community than Datadog or Grafana, so fewer answers in forums.
- Setup takes longer than a cloud tool you sign up for online.
- Correlation rules need tuning before they are useful.
Pricing
Quote only, based on how many devices you monitor and how many logs you keep.
A free trial and guided demo are available.
2. SigNoz
Best For: Engineering departments that want open-source tracing they can host themselves.
SigNoz is one of the closest open-source alternatives to Honeycomb.
It handles traces, metrics, and logs in one interface and runs on OpenTelemetry, so your services send data through open standards rather than a vendor agent.
If they already send OpenTelemetry data to Honeycomb, most of that setup work carries across.
Hosting it yourself costs nothing in software, which removes the per-event bill completely. Your only outlay is the storage and the servers behind it.
Running trace storage at production volume takes engineering time, and the community behind SigNoz is smaller than the ones behind the paid platforms.
If you prefer not to manage it yourself, SigNoz also offers a managed cloud version.
Pros
- No license fee if you host it yourself.
- Using OpenTelemetry means you are not locked to one vendor.
- The code your services already use to send data works here with little change.
- Active open-source project with regular releases.
- Data stays on your own systems if you self-host.
Cons
- Running trace storage at production volume takes engineering time.
- Smaller community than Grafana or Datadog, so fewer worked examples online.
- No infrastructure monitoring for network hardware.
- The managed version is billed on data volume, so the cost is harder to predict again.
- Fewer prebuilt integrations than the paid platforms.
Pricing
Self-hosted: free and open source. You pay for your own servers and storage.
SigNoz Cloud: billed on the volume of traces, logs, and metrics you send.
For a closer look at the costs, see our SigNoz pricing guide.
3. Grafana Cloud
Best For: Teams already using Grafana for dashboards and visualization.
Grafana Cloud is a natural choice for teams already using Grafana.
With Tempo, Loki, and Mimir, it brings traces, logs, and metrics into the same environment while letting engineers continue using the dashboards they already know.
Existing dashboard work can carry over, and its OpenTelemetry support makes migration easier if you're moving from Honeycomb.
Pricing is based on how much data you store and how long you keep it, which can be easier to plan for than event-based pricing.
Pros
- Your existing Grafana dashboards and skills carry straight across.
- One bill covers traces, metrics, and logs rather than three products.
- The free tier is generous enough for small production systems.
- A very large community, so most problems have been solved publicly.
- You can self-host the same components if you want to leave the cloud version.
Cons
- Setting up three storage back ends takes more work than one hosted tool.
- Query languages differ between traces, logs, and metrics, which slows new users down.
- Costs rise with how long you keep data, not just how much you send.
- Support quality varies by plan.
- Tracing analysis is less focused than Honeycomb's.
You can also check our Grafana alternatives guide to explore other options.
Pricing
Free tier with a set amount of metrics, logs, and traces each month.
Paid plans are billed on how much data you send and how long you keep it, starting from a low monthly minimum.
Our Grafana Cloud pricing guide breaks down its plans and pricing.
4. Datadog
Best For: Cloud-native setups that need tracing and infrastructure monitoring together.
Datadog brings infrastructure, applications, logs, and user monitoring together in one platform, making it a strong option if you need both tracing and infrastructure visibility.
It also supports a wide range of integrations across cloud platforms, databases, containers, and other infrastructure, so most services can be connected without much custom work.
Metrics, traces, and logs are available in the same place, which makes it easier to investigate an issue without constantly switching between tools.
The main thing to understand is the pricing.
Its Infrastructure monitoring, application monitoring, log management, and other capabilities are priced separately, so costs can grow as you add more modules.
Pros
- Rates are published, so you can model the bill before contacting sales.
- Cloud accounts start reporting within minutes of connecting.
- Covers infrastructure as well as applications, which removes a second tool.
- Documentation is thorough and most problems have a published answer.
- New features ship often.
Cons
- Separate meters make the total bill hard to predict.
- No on-premises option at any tier.
- Log and custom metric charges are easy to run up by accident.
- The learning curve across so many modules is steep.
- Trace sampling rules need attention to keep costs down, the same as Honeycomb.
Our Datadog pricing guide breaks down how its pricing works.
5. New Relic
Best For: Teams that want broad observability across apps, infrastructure, logs, and user experience with data-volume-based pricing.
New Relic uses a pricing model based on data volume and user seats rather than hosts or events. This can work well for teams running many services with a smaller number of engineers.
You get a set amount of free data each month and one free full-platform user. Beyond that, you pay for additional data and users.
The platform covers traces, metrics, logs, browser monitoring, and infrastructure.
Pricing can be easier to predict when data volumes are steady, but costs can still increase during traffic spikes.
Pros
- The free amount of data is large enough for small production systems.
- Billing by data volume avoids per-host charges when you run a lot of containers.
- One platform covers front-end, application, and infrastructure monitoring.
- Long track record, with a large body of public documentation.
- You can add read-only users without paying full-platform rates.
Cons
- Full-platform user seats get expensive as the engineering group grows.
- Data spikes still raise the bill, the same problem you have with Honeycomb.
- The interface covers a lot of ground and takes time to learn.
- No self-hosted option.
You can also check our New Relic alternatives guide to compare other options.
Pricing
Free tier with a set amount of data each month and one full-platform user.
Paid usage is billed per GB above that amount, with separate charges for full-platform users.
Our New Relic pricing guide explains how its pricing works.
6. Dynatrace
Best For: Larger engineering departments that want tracing set up automatically.
Dynatrace suits larger setups where nobody has time to add tracing code to every service by hand. You install OneAgent on a host and it finds the processes, containers, and services running there on its own, which is the main difference from Honeycomb.
Its Davis engine then names a likely cause instead of a list of related alerts, and on a large system that can save an hour of searching.
The price sits well above Honeycomb for the same coverage. See our Dynatrace pricing guide for how the hourly rates add up, and our Dynatrace alternatives post for cheaper options.
Pros
- Very little setup work once the agent is on the host.
- Cuts investigation time on complicated application problems.
- Keeps up with environments that change daily without manual updates.
- Strong container and Kubernetes support.
- Hourly rates are published.
Cons
- Priced well above Honeycomb for the same coverage.
- More capability than a small engineering group will use.
- You pay by usage, so the bill needs checking every month.
- You get less control than you would writing the tracing code yourself.
- It takes time to learn across the full platform.
Pricing
Full-stack monitoring: from $0.08 per hour for each 8 GiB host, billed hourly.
Infrastructure monitoring: from $0.04 per hour per host.
Log management and other capabilities are billed on separate meters.
7. Splunk Observability Cloud
Best For: Large organizations that need complete tracing, infrastructure monitoring, and log analytics in one platform.
Splunk Observability Cloud brings together traces, metrics, and infrastructure monitoring with Splunk's log analytics capabilities.
It is a strong option for teams already using Splunk for security. Keeping application and operational data alongside existing logs can make incident investigations easier.
Splunk also keeps every trace instead of relying on sampling, which may appeal to teams that want complete visibility into their application data.
The downside is cost. Smaller teams may end up paying for capabilities they do not need.
You can also check our Splunk alternatives guide to explore other options.
Pros
- No sampling rules to maintain, because every trace is kept.
- Application data sits next to security logs you already store.
- Built on OpenTelemetry, so you are not locked to one vendor.
- Handles very large data volumes without tuning.
- Strong reporting for organizations that need audit trails.
Cons
- Among the most expensive options on this list.
- Overbuilt for a small engineering group.
- Steep learning curve for anyone new to Splunk.
- Pricing takes work to model before you commit.
- No self-hosted version of the observability product.
Pricing
Infrastructure Monitoring: from $15 per host per month on annual billing.
Application Performance Monitoring is priced separately per host.
Log Observer and other capabilities are billed on their own meters.
Our Splunk pricing guide breaks down how its costs add up at scale.
8. Coralogix
Best For: High-volume environments that need more affordable storage for rarely queried data.
Coralogix uses a tiered pricing model based on how often you need to access your data, which can make it worth considering if Honeycomb's event-based pricing is becoming expensive.
Data you query frequently stays available for fast searches, while data you mainly keep for compliance or occasional reference can be moved to lower-cost storage.
This can help reduce costs when you're dealing with large volumes of data that don't all need the same level of access.
Coralogix covers logs, metrics, and traces and also supports OpenTelemetry.
Pros
- Storage tiers cut the bill on data you rarely query.
- Costs are easier to model than per-event billing.
- Covers logs as thoroughly as traces, which Honeycomb does not.
- Accepts OpenTelemetry, so the code your services already use carries across.
- Alerting works on archived data as well as live data.
Cons
- Assigning streams to the right tier takes setup work.
- Smaller community than Datadog, Grafana, or New Relic.
- Fewer prebuilt integrations than the largest platforms.
- No infrastructure monitoring for network hardware.
- Cloud-only, with no self-hosted option.
Pricing
Billed by data volume, with rates varying by storage tier.
A free tier is available.
Our Coralogix pricing guide explains how its pricing tiers work.
How to Choose the Right Honeycomb Alternative
The right replacement depends on why you are leaving Honeycomb. These questions will cut your shortlist down quickly.
Name the problem first: Cost, missing infrastructure monitoring, cloud-only hosting, or the query model. Your answer will rule out most of this list straight away.
Work out what you are already paying for twice: If you run a second tool for servers and databases, price the alternatives that replace both.
Check how each one bills: Per event, per host, per gigabyte, per user, and per usage hour all grow at different speeds. Model each one at twice your current volume.
Check what your services already send: If they use OpenTelemetry, SigNoz, Grafana Cloud, New Relic, Splunk, and Coralogix will take that data without a rewrite.
Decide whether sampling is a problem: If maintaining sampling rules is part of why you are leaving, look at tools that keep every trace.
Match the skills you have: SigNoz and self-hosted Grafana cost nothing to license but take staff time to run. Hosted tools cost money and save you that time.
Test the alert volume: During a trial, break something in a test environment and count the notifications. One incident should produce one alert, not twenty. Our guide on avoiding alert fatigue is worth reading first.
Run a trial properly: Send real production traffic for two weeks before signing. A demo will not show you the problems that two weeks of use will.
Pick the Right Alternative for Your Observability Needs
The right choice depends on what you need beyond tracing. If Honeycomb already works for your use case, there may be no reason to switch.
Choose an open-source option like SigNoz if cost is the main concern. If you need broader coverage across applications, infrastructure, and logs, a full observability platform may be a better fit.
Before making a decision, test your shortlisted tools with real production traffic. A trial will tell you far more than a demo.
FAQs
What are alternatives to Honeycomb?
Motadata ObserveOps, SigNoz, Grafana Cloud, Datadog, New Relic, Dynatrace, Splunk Observability Cloud, and Coralogix. They do different jobs, from tracing on its own up to full infrastructure and log coverage, so work out which one you need before you compare prices.
Is there a free or open-source alternative to Honeycomb?
SigNoz is the closest one. It is open source, built on OpenTelemetry, and free to run on your own servers, so your only cost is storage. Grafana Cloud has a free tier and its components can also be self-hosted. Both need engineering time to run at production volume.
How much does Honeycomb cost?
Honeycomb has a free tier with a set number of events each month, a paid plan for growing systems, and custom enterprise pricing. Billing is based on the number of events you send, so the bill moves with your traffic. Our guide to Honeycomb pricing breaks down the tiers.
Which Honeycomb alternative runs on-premises?
SigNoz and Grafana both have self-hosted versions you run on your own hardware. Motadata ObserveOps also deploys on-premises, and it covers infrastructure and logs as well as application data. Datadog, New Relic, Dynatrace, Splunk Observability Cloud, and Coralogix are cloud-only.
Which alternative is best for distributed tracing?
SigNoz is the closest match to how Honeycomb works, and it takes the same OpenTelemetry data. Splunk Observability Cloud keeps every trace rather than a sampled share, which suits you if sampling rules were part of the problem. With Dynatrace you do not write any tracing code. Its agent finds your services and starts tracing them on its own.
Author
Ramya Shah
Technical Writer
Ramya Shah is a technical content writer with a computer engineering background and roots in automotive journalism. He covers IT Service Management, observability, IT operations, and AI-driven automation. An early adopter of AI-assisted writing workflows, he turns complex IT processes into clear, engaging content optimized for search and answer engines (AEO), lifting content output and organic visibility.