What Is NetFlow Traffic Monitoring? How Flow Data Gives You Full Network Visibility
Arpit Sharma
What is NetFlow traffic monitoring? NetFlow traffic monitoring is a method of collecting and analyzing network flow data — the metadata of every network conversation — to gain visibility into bandwidth usage, traffic patterns, and potential security threats. It tells you who's talking to whom, how much data they're moving, and whether the patterns look normal.
Your network is getting slower. Users are complaining. The help desk is flooded with vague tickets about "the internet being down." But when you check the infrastructure, everything looks green.
That's a visibility problem, not a capacity problem. And it's exactly what NetFlow was designed to solve. Instead of guessing which application or department is eating your bandwidth, NetFlow gives you the actual data — flow-by-flow, IP-by-IP, protocol-by-protocol.
Originally developed by Cisco in the 1990s, NetFlow has become the standard for flow-based network traffic analysis. It doesn't capture full packet payloads like a packet sniffer. Instead, it records the metadata of each conversation: source IP, destination IP, port numbers, protocol, byte count, and duration. That's enough to answer 90% of the questions network teams ask every day.
Key Takeaways
NetFlow traffic monitoring records the metadata of every network conversation — source, destination, protocol, bytes, and duration — without capturing full packet contents.
It's the fastest way to answer "who's using the bandwidth" and "what changed on the network" without deploying packet sniffers everywhere.
NetFlow works through a three-step pipeline: devices generate flow records, exporters send them to a collector, and an analyzer turns them into actionable dashboards and alerts.
Flow-based analysis is your first line of defense for detecting security anomalies like data exfiltration, DDoS attacks, and unauthorized lateral movement.
NetFlow v5, v9, IPFIX, sFlow, and JFlow all serve similar purposes but differ in flexibility, vendor support, and sampling methods. Most modern platforms support all of them.
You don't need to choose between NetFlow and SNMP — they complement each other. SNMP tells you about device health; NetFlow tells you about traffic behavior.
How NetFlow Traffic Monitoring Works
NetFlow operates through a straightforward three-stage pipeline. Understanding each stage helps you design a monitoring architecture that actually fits your network.
Flow Record Generation
Every NetFlow-capable device — routers, switches, firewalls — maintains a flow cache. When a new network conversation starts (defined by a unique combination of source IP, destination IP, source port, destination port, protocol, and type of service), the device creates a flow record. As packets belonging to that flow pass through, the device updates the record with byte counts, packet counts, and timestamps.
When the flow ends (or a timeout triggers), the device marks the record as complete and queues it for export.
Flow Export
The device exports completed flow records to a central NetFlow collector using UDP or SCTP. Export intervals are configurable — most teams set them between 1 and 5 minutes depending on the volume of traffic and the granularity they need.
NetFlow v5 uses a fixed record format. NetFlow v9 and IPFIX use templates, which means you can include additional fields like VLAN tags, BGP autonomous system numbers, or MPLS labels without changing the protocol.
Collection and Analysis
A NetFlow analyzer receives the exported records, stores them, and presents them through dashboards, reports, and alerts. This is where raw flow data becomes operational intelligence — top talkers, bandwidth hogs, traffic trends, anomaly alerts, and forensic drill-downs.
The best analyzers don't just show you what happened. They correlate flow data with SNMP metrics, syslog events, and application performance data to give you the full picture.
Why Network Teams Rely on NetFlow Monitoring
Network administrators don't monitor traffic for fun. They do it because without flow-level visibility, they're operating blind — reacting to symptoms instead of identifying causes.
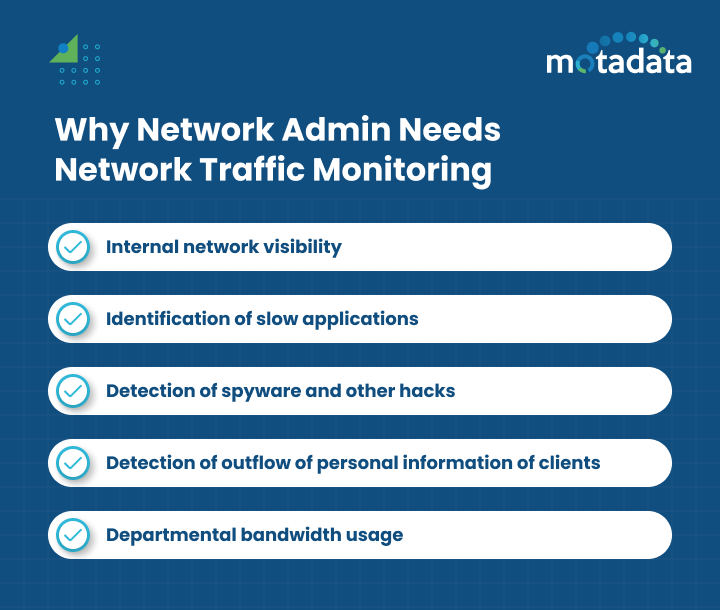
Complete Internal Network Visibility
Flow monitoring protocols like NetFlow, IPFIX, sFlow, and JFlow give you a complete breakdown of internal traffic. You can see traffic by application, by conversation pair, by department, by protocol, by port — whatever dimension matters for your troubleshooting or capacity planning.
With Motadata's flow analytics, IT teams generate reports on top applications, top conversations, traffic sources and destinations by IP, protocol distribution, and port-level traffic patterns.
Finding the Root Cause of Slow Applications
When a user reports that their video conference app is choppy or their CRM is loading slowly, the problem could be anywhere — server load, application bugs, or network congestion. NetFlow narrows the search instantly.
By filtering flow data for that application's traffic, you can see whether the network path is congested, whether another application is consuming disproportionate bandwidth, or whether the traffic is being routed through an unexpected path. That's hours of troubleshooting compressed into minutes.
Detecting Security Threats
NetFlow data is one of the most effective tools for spotting network-level security incidents. Unusual traffic patterns stand out clearly in flow analysis:
A server suddenly communicating with an external IP it's never contacted before
A spike in outbound data transfer during off-hours (potential data exfiltration)
Lateral movement between internal hosts that don't normally communicate
DDoS traffic patterns showing massive inbound flows from distributed sources
Command-and-control traffic with small, regular beacons to unknown destinations
Unlike signature-based intrusion detection, flow analysis catches threats based on behavior patterns — which means it can identify novel attacks that don't match known signatures.
Protecting Sensitive Data
For organizations handling payment card data, healthcare records, or other regulated information, NetFlow provides a continuous audit trail of data movement. If sensitive data starts leaving the network through unexpected channels, flow monitoring flags it immediately — often before traditional DLP tools catch it.
Tracking Departmental Bandwidth Usage
When the network feels slow but you can't pinpoint why, NetFlow shows you exactly which departments, devices, and applications are consuming bandwidth. Maybe the marketing team is streaming 4K video all day. Maybe a backup job is running during peak hours. Maybe a misconfigured device is generating broadcast storms.
You can't fix what you can't see. NetFlow gives you the visibility to make informed decisions about bandwidth allocation, QoS policies, and infrastructure upgrades.
NetFlow vs sFlow vs IPFIX: Choosing the Right Flow Protocol
Most modern network monitoring tools support multiple flow protocols. Here's how they compare:
Feature | NetFlow v5 | NetFlow v9 | IPFIX | sFlow | JFlow |
|---|---|---|---|---|---|
Vendor origin | Cisco | Cisco | IETF standard | InMon | Juniper |
Record format | Fixed | Template-based | Template-based | Sampled packets | Fixed/Template |
Sampling | No (full flow) | Optional | Optional | Yes (always) | Optional |
IPv6 support | No | Yes | Yes | Yes | Yes |
MPLS support | No | Yes | Yes | Limited | Yes |
Flexibility | Low | High | Highest | Medium | Medium |
Best for | Legacy Cisco environments | Modern Cisco networks | Multi-vendor environments | High-speed networks | Juniper environments |
Which one should you use? If you're running a multi-vendor network, IPFIX is the safest bet — it's an IETF standard based on NetFlow v9. If your switches are Cisco, NetFlow v9 gives you the richest data. If you need flow data from 100 Gbps links where full flow capture isn't practical, sFlow's sampling approach keeps the overhead manageable.
The good news: you don't have to choose just one. Platforms like Motadata support NetFlow v5, v9, IPFIX, sFlow, and JFlow simultaneously, so you can use whatever protocol each device supports natively.
5 Key Benefits of NetFlow Traffic Monitoring
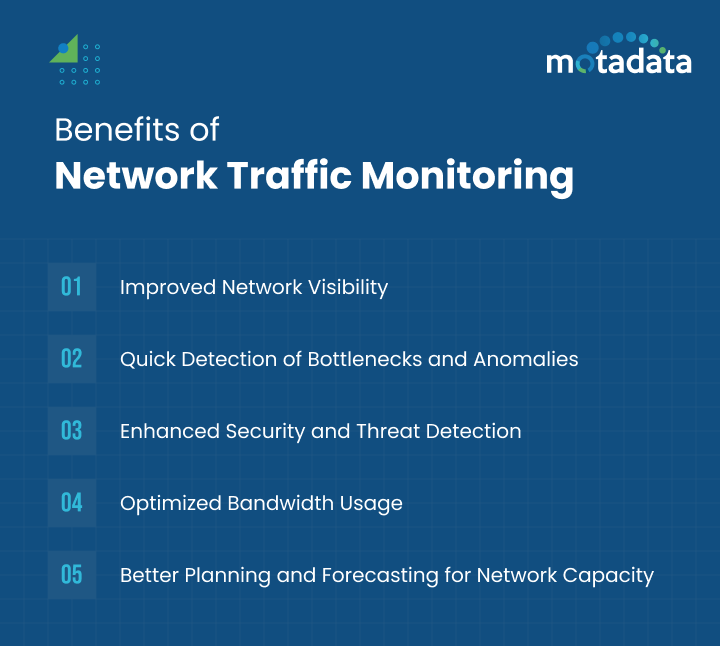
1. Full Network Visibility Without Packet Capture
NetFlow gives you 90% of the insight of full packet capture at a fraction of the processing and storage cost. You won't see payload contents, but you'll know exactly who's talking to whom, how much data is moving, and which protocols are in use. For most operational and capacity planning questions, that's more than enough.
2. Faster Troubleshooting
When something goes wrong on the network, flow data cuts the diagnostic cycle dramatically. Instead of running traceroutes and checking device logs one by one, you can filter flow records by time window, application, source, or destination and see exactly what changed. Teams using flow-based troubleshooting typically resolve network performance issues 40-60% faster than those relying on SNMP alone.
3. Proactive Capacity Planning
Historical flow data shows you how traffic patterns evolve over weeks and months. You can spot trends — growing bandwidth consumption on specific links, seasonal traffic spikes, gradual shifts in application mix — and plan upgrades before congestion becomes a problem. That's cheaper and less disruptive than adding bandwidth reactively after users start complaining.
4. Stronger Security Posture
Flow data provides a continuous behavioral baseline for your network. When something deviates — unusual traffic volumes, new communication patterns, unexpected protocol usage — your monitoring system can flag it automatically. This makes NetFlow a natural complement to firewalls, IDS/IPS, and SIEM solutions.
5. Optimized Bandwidth Allocation
Once you can see exactly how bandwidth is being consumed, you can make informed decisions about QoS policies, traffic shaping, and link upgrades. Maybe you don't need more bandwidth — maybe you need to prioritize voice and video traffic over bulk file transfers. NetFlow data tells you which changes will have the most impact.
Best Methods for Monitoring Network Traffic
Different monitoring approaches serve different purposes. Most mature network operations teams use a combination.
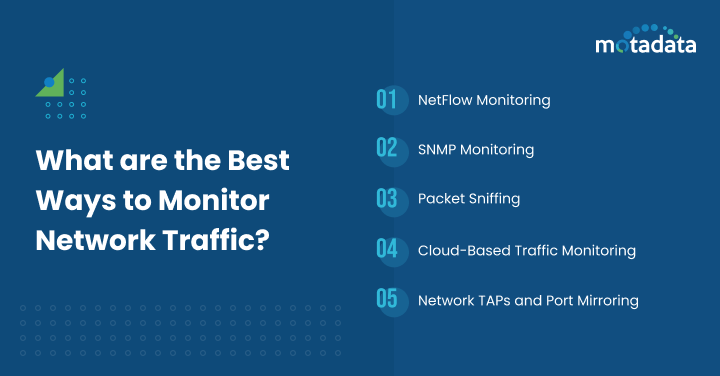
NetFlow / IPFIX Monitoring
Flow-based monitoring is the best approach for understanding traffic patterns, bandwidth usage, and communication relationships across your network. It's relatively lightweight on the devices that generate the data and provides rich analytics at the collector.
Best for: Bandwidth analysis, capacity planning, traffic accounting, security anomaly detection.
SNMP Monitoring
SNMP monitoring focuses on device-level health — CPU utilization, memory usage, interface status, uptime, and error counters. It tells you how your devices are doing, not what traffic is flowing through them.
Best for: Device health monitoring, uptime tracking, interface utilization, hardware fault detection.
Packet Capture and Deep Packet Inspection
Full packet capture records everything — headers and payloads. It's the most detailed monitoring method but also the most resource-intensive. Most teams deploy it selectively for specific troubleshooting scenarios or security forensics rather than running it continuously across the entire network.
Best for: Deep application troubleshooting, security forensics, protocol analysis, compliance auditing.
Cloud-Based Traffic Monitoring
For organizations running workloads in AWS, Azure, or Google Cloud, cloud-native flow logs (VPC Flow Logs, NSG Flow Logs) provide visibility into cloud traffic. Integrating these with your on-prem flow data gives you a unified view across hybrid environments.
Best for: Hybrid and multi-cloud environments, cloud security monitoring, cross-environment traffic analysis.
Network TAPs and Port Mirroring
TAPs and SPAN ports copy traffic to monitoring tools without affecting production flows. They're typically used to feed packet capture tools, IDS sensors, or network forensics platforms.
Best for: Non-intrusive traffic capture, security monitoring, forensic analysis.
How to Choose the Right NetFlow Analysis Tool
Not all traffic analysis tools are created equal. Here's what matters when you're evaluating options:
Protocol support: Does it support NetFlow v5, v9, IPFIX, sFlow, and JFlow? Multi-protocol support means you won't need to replace the tool when your network evolves.
Scalability: Can it handle the flow volume your network generates? A tool that works for 100 devices might choke at 1,000.
Real-time analysis: Can it detect anomalies and send alerts in real time, or does it only offer historical reporting?
Integration with broader monitoring: Does it integrate with SNMP monitoring, log management, and application performance monitoring? Isolated flow data is useful. Correlated data is powerful.
Custom dashboards and reporting: Can you build views that match your operational workflows — top talkers, departmental usage, application breakdown, security alerts?
Historical data retention: How far back can you look? Capacity planning and forensic analysis both require months of historical data.
How Motadata Simplifies NetFlow Traffic Monitoring
Motadata's flow analytics platform supports NetFlow v5, v9, IPFIX, sFlow, and JFlow out of the box — so you get full flow visibility regardless of your network vendor mix. The platform ingests flow data alongside SNMP metrics, logs, and application performance data, giving you correlated insights in a single console.
What makes it practical for network teams: automated traffic baselining that flags anomalies without manual threshold configuration, pre-built dashboards for top talkers, bandwidth hogs, and protocol distribution, plus drill-down forensics that let you go from a high-level traffic spike to the specific IP conversation causing it in two clicks. Teams running Motadata typically cut their mean time to identify network issues by 50% or more.
Ready to see your network traffic clearly? Start a free 30-day trial or request a demo to see Motadata in action.
FAQs
What is NetFlow traffic monitoring and how does it work?
NetFlow traffic monitoring collects metadata about every network conversation — source IP, destination IP, ports, protocol, byte count, and duration. Network devices generate flow records, export them to a central collector, and an analyzer turns that data into dashboards, reports, and alerts. It gives you complete visibility into who's using the network, what applications are consuming bandwidth, and whether traffic patterns look normal.
What is the difference between NetFlow and sFlow?
NetFlow (developed by Cisco) records complete flow data for every network conversation by default. sFlow (developed by InMon) uses statistical sampling — it captures a subset of packets and extrapolates traffic patterns from that sample. NetFlow provides more granular data; sFlow generates less overhead on high-speed links. IPFIX, the IETF standard, is based on NetFlow v9 and works across multi-vendor environments.
How does NetFlow help with network security?
NetFlow detects security threats by identifying abnormal traffic patterns — sudden spikes in outbound data (potential exfiltration), communication with unknown external IPs (command-and-control traffic), unusual lateral movement between internal hosts, or volumetric anomalies that indicate DDoS attacks. Because it analyzes behavior rather than signatures, it can catch threats that traditional IDS/IPS systems miss.
How do I set up NetFlow monitoring on my network?
Start by enabling NetFlow export on your routers and switches (most enterprise devices support it natively). Configure an export destination pointing to your NetFlow collector. Set export intervals (1-5 minutes is typical). Deploy a NetFlow analyzer like Motadata to receive, store, and visualize the data. Finally, establish traffic baselines so the system can alert you when patterns deviate from normal.
Does NetFlow monitoring replace the need for SNMP?
No — they're complementary. SNMP monitors device health (CPU, memory, interface status, uptime). NetFlow monitors traffic behavior (who's talking to whom, bandwidth usage, application traffic). Most network operations teams use both: SNMP for infrastructure health and NetFlow for traffic intelligence.
Author
Arpit Sharma
Senior Content Marketer
Arpit Sharma is a Senior Content Marketer at Motadata with over 8 years of experience in content writing. Specializing in telecom, fintech, AIOps, and ServiceOps, Arpit crafts insightful and engaging content that resonates with industry professionals. Beyond his professional expertise, he is an avid reader, enjoys running, and loves exploring new places.


