DevOps with Kubernetes: How to Reduce Cluster Toil and Complexity
Has Kubernetes made your DevOps team faster, or just busier? Most teams adopt it for speed and portability, and they get both. What arrives with it is a quieter cost: the operational weight of running the cluster day to day.
That weight shows up in the manual work the platform was supposed to eliminate. A resource limit set incorrectly can waste infrastructure for months. Configuration spread across dozens of YAML files turns routine changes into risky ones, while a single failing pod can disappear behind a wall of alerts.
The challenge is widespread. According to CNCF's survey, 82% of container users now run Kubernetes in production, up from 66% in 2023. As adoption grows, teams encounter the same set of operational challenges: complexity, cost, configuration, monitoring, and CI/CD. This article explores each one and practical ways to reduce the operational burden.
How is Kubernetes Used in DevOps?
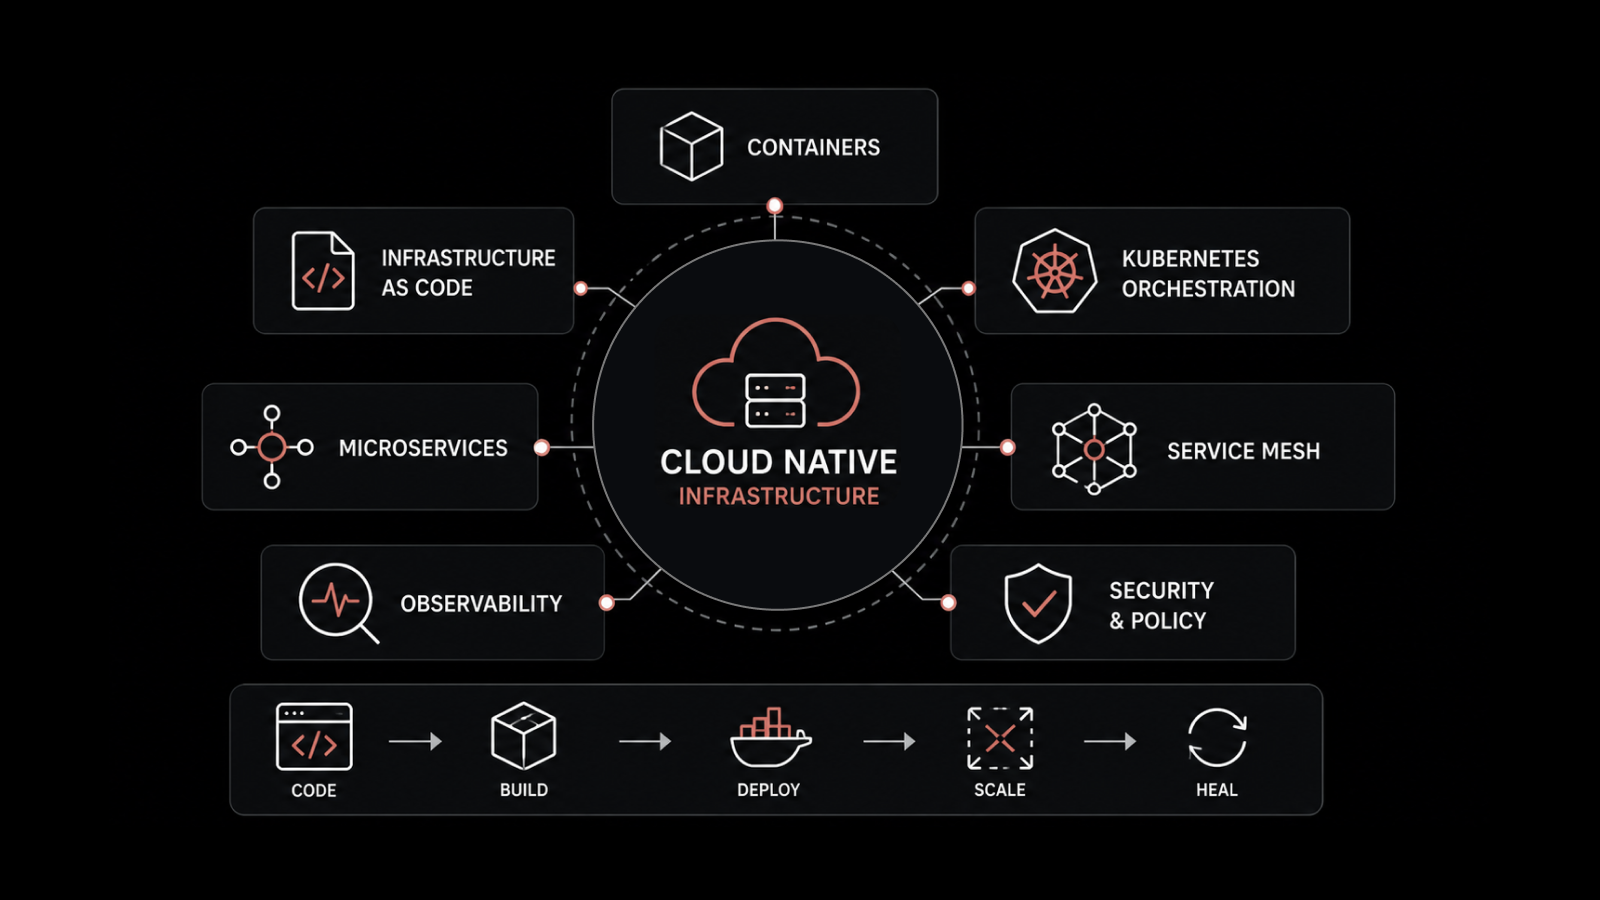
Kubernetes is used in DevOps as the runtime that delivery pipelines deploy into. It runs containerized applications across a group of machines called a cluster, scheduling containers, restarting the ones that fail, and moving workloads when a node goes down. That makes it the layer where DevOps teams ship, scale, and recover their applications.
So is Kubernetes a DevOps tool? Not on its own. It is an orchestration platform that DevOps teams build around, and DevOps itself is a way of working that joins development and operations so software ships often and breaks less. Kubernetes fits that model because it makes deployments repeatable and rollbacks fast.
The clearest way to think about it: Kubernetes is part of DevOps the way an engine is part of a car. It does heavy work, but it does not drive itself. Someone still owns the pipelines, the alerts, the cost, and the deploy that goes sideways at 2 a.m.
What Makes a Kubernetes Cluster Complex to Manage?
Kubernetes complexity comes from the number of interconnected components that keep a cluster running. The control plane, including the API server, scheduler, controller manager, and etcd, coordinates every workload. Because these components depend on one another, an issue in one part can quickly affect the entire cluster while remaining difficult to pinpoint.
Containers also introduce a new operating model. Teams familiar with virtual machines must learn image management, container lifecycles, and resource scheduling across pods. Even as Kubernetes adoption matures, 34% of teams still cite complexity as a major challenge in CNCF's 2025 survey.
How That Complexity Turns into Daily Manual Work
As clusters grow, operational overhead grows with them. Every setting that isn't automated becomes another manual task. A team running dozens of microservices must manage separate deployments, resource policies, and failure scenarios for each service.
The result is repetitive work such as:
Investigating pods that restart without an obvious cause
Editing YAML files to recover failed deployments
Tracing why workloads were evicted or rescheduled
These tasks rarely deliver business value, yet they consume engineering time every day. Most stem from a handful of recurring operational issues.
Common pain point | Why it hurts | What reduces it |
Manual YAML edits | Small mistakes cause outages | Version control and templating |
Wrong resource limits | Wasted spend or evicted pods | Requests, limits, and autoscaling |
Alert overload | Real issues get buried | Correlation and noise reduction |
Config drift across environments | Bugs that only appear in prod | Infrastructure as code |
Slow manual rollbacks | Longer outages | Automated rollouts |
As automation takes over routine operational tasks, teams can focus on improving applications instead of maintaining infrastructure.
How to Manage a Kubernetes Cluster without the Operational Overhead?
Managing a Kubernetes cluster comes down to three ongoing priorities: controlling costs, keeping configurations consistent, and maintaining visibility into cluster health. The right practices reduce manual work by shifting routine operations from people to automation.
1. Optimize Resource Usage and Control Costs
Kubernetes can scale workloads in seconds, but that same flexibility can quietly increase infrastructure costs. Without the right resource controls, unused capacity costs just as much as productive workloads.
Three controls keep spend in check:
Requests and limits on every container, so the scheduler knows what a pod needs and caps what it can take
Resource Quotas and Limit Ranges at the namespace level, so one noisy app cannot starve the cluster
Horizontal Pod Autoscaler to add or remove replicas on demand, so you pay for peak only when peak arrives
Accurate resource requests and limits have the biggest impact, but they're not a one-time configuration. They need regular tuning based on actual usage, where monitoring and cloud cost optimization work together.
2. Keep Configuration Consistent Across Environments
A small cluster has a handful of manifests. A large one has hundreds, spread across environments, and that is where order breaks down. The fix is to treat configuration as code, not as files someone edits in place.
Three practices keep configuration under control as you grow:
Version control every manifest in Git for history, review, and clean rollbacks.
Manage infrastructure as code so you can define the desired state and let tooling reconcile the cluster automatically.
Use Helm templates to deploy the same chart across development, staging, and production with environment-specific values.
GitOps brings these practices together by making Git the single source of truth for cluster configuration. When every environment is deployed from the same repository, configuration drift decreases and production-only issues become far less common.
3. Gain Complete Visibility Across the Cluster
You can't reduce operational effort without visibility. Kubernetes monitoring goes beyond tracking nodes and pods. It also requires visibility into application performance, resource usage, and service dependencies across a constantly changing environment.
Most teams start with Prometheus for metrics, and that works at first. The gap shows up later, when an incident spans logs, metrics, and network flows at once, and you are stuck pivoting between tools. Watching the right signals helps: the golden signals of latency, traffic, errors, and saturation tell you more about user pain than raw CPU graphs do.
Monitoring area | What to watch |
Cluster health | Node status, CPU and memory pressure, etcd health |
Application health | Request latency, error rate, throughput |
Resource use | Pod consumption against requests and limits |
Network | Inter-service traffic, dropped connections |
This is where a unified platform earns its keep. Motadata ObserveOps brings metrics, logs, flows, traces, and topology into one place, and its DFIT engine correlates them so related alerts collapse into a single incident instead of a wall of noise. In Kubernetes, where one failing dependency can trigger fifty downstream alerts, that is the difference between a five-minute triage and an hour of tab-switching.
The value extends beyond Kubernetes. At 7-Eleven, ObserveOps monitors roughly 300 network nodes and processes around 3 GB of logs daily, combining network, server, log, and flow telemetry in a single platform. The retailer reports faster root cause analysis and reduced downtime through consolidated visibility.
How to Run CI/CD Pipelines on Kubernetes
CI/CD pipelines on Kubernetes automate the journey from a code commit to a running application. Continuous Integration builds and tests every change, while Continuous Delivery deploys the updated container image and lets Kubernetes roll it out across the cluster.
The workflow is simple: build a container image, push it to a registry, and update the deployment manifest with the new image tag. Tools such as Jenkins, GitLab CI/CD, and Argo CD can automate this process. More important than the tool itself is following proven CI/CD practices that keep deployments reliable and repeatable.
Kubernetes supports several deployment strategies to reduce release risk:
Rolling updates gradually replace existing pods and automatically pause or roll back if health checks fail.
Canary releases route a small percentage of traffic to the new version before a full rollout.
Blue-green deployments run two production environments and switch traffic between them, enabling near-instant rollbacks.
With the right pipeline and deployment strategy, software releases become a routine, low-risk process instead of a scheduled event.
What Sets High-Performing Kubernetes Teams Apart?
The difference between efficient Kubernetes teams and overwhelmed ones is how much of the operational work they've automated. Instead of relying on manual intervention, they build repeatable processes that keep clusters reliable as they scale.
Five practices make the biggest difference:
Version every manifest so changes are reviewable and reversible.
Right-size resources using actual usage data, not estimates.
Autoscale workloads so capacity matches demand.
Automate deployments and rollbacks to reduce operational risk.
Correlate monitoring data so each incident generates one actionable alert instead of hundreds.
The last practice often delivers the biggest productivity gain. Excessive alert noise leads to alert fatigue, making it easier to overlook critical issues. Alert noise reduction helps teams focus on what matters by correlating related alerts into a single incident, enabling faster root cause analysis, less manual investigation, and quicker resolution.
Correlate, Automate, and Scale Kubernetes with Motadata
Managing Kubernetes gets easier when repetitive operational work moves from people to automation.
That shift takes effort. Adopting GitOps, tuning autoscaling, and standardizing cluster operations all require upfront investment. In fact, CNCF's 2025 survey found that 47% of teams cite cultural change, not tooling, as their biggest challenge.
Motadata ObserveOps helps simplify that journey. By bringing metrics, logs, traces, flows, and topology into a single correlated view, it reduces alert noise, accelerates root cause analysis, and gives your team the visibility to manage Kubernetes more efficiently, so they can spend less time maintaining clusters and more time delivering software.
FAQs
Is Kubernetes a DevOps tool?
Kubernetes is a container orchestration platform, not a DevOps tool. DevOps teams use it to deploy, scale, and manage containerized applications, while CI/CD pipelines, monitoring, and automation enable DevOps practices. Kubernetes supports DevOps, but it is only one part of the overall workflow.
What is the hardest part of scaling DevOps with Kubernetes?
For many teams, the biggest challenge is managing resources and reducing alert noise, not deployments. Poorly configured resource requests and limits can waste infrastructure or cause pod evictions, while excessive alerts lead to alert fatigue. Autoscaling and correlated monitoring help make Kubernetes operations more efficient and scalable.
How do you reduce DevOps toil in Kubernetes?
Reduce DevOps toil by automating repetitive operational tasks. Store manifests in version control, configure resource requests and limits, use autoscaling to match capacity with demand, automate deployments and rollbacks, and correlate monitoring data so related alerts become a single actionable incident.
How does Kubernetes improve CI/CD pipelines?
Kubernetes enables CI/CD pipelines to deploy applications using rolling updates, canary releases, and automated rollbacks. These capabilities reduce deployment risk, support frequent releases, and allow teams to recover quickly if a release introduces issues.
What should DevOps teams monitor in a Kubernetes cluster?
DevOps teams should monitor cluster health, including node status, CPU and memory pressure, and etcd health; application health, including latency, error rates, and throughput; and resource usage against configured requests and limits. Bringing these metrics, logs, traces, and network flows together in a unified view helps reduce alert noise and speed up root cause analysis.
Author
Poonam Lalani
Content Strategist
Poonam Lalani is a B2B content strategist and writer with a background in computer engineering and experience across enterprise technology domains, including AI, cloud, DevOps, data engineering, and IT operations. She specializes in creating research-driven content that simplifies complex ideas and supports product education, thought leadership, and business growth.