AI and ML in Network Performance Monitoring: What They Actually Do and Why It Matters
Amartya Gupta
AI and ML in network performance monitoring refers to the application of artificial intelligence and machine learning algorithms to automate anomaly detection, predict network failures, establish dynamic baselines, and analyze log data — replacing static, rule-based monitoring with adaptive, data-driven intelligence.
Hook
Network teams today manage infrastructure that's more distributed, more dynamic, and more critical than ever. Static thresholds and manual alert triage don't scale when you're monitoring thousands of devices across hybrid environments. AI and machine learning have moved past the hype — they're now core to how modern network monitoring tools detect issues, predict failures, and reduce the operational load on IT teams. Here's what these capabilities actually look like in practice, and why they matter for your monitoring strategy.
Key Takeaways
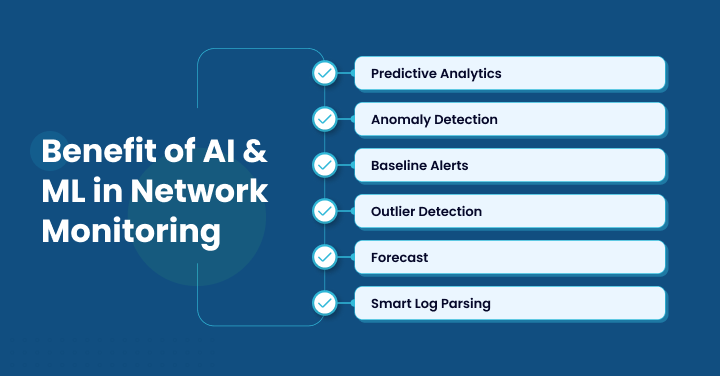
Predictive analytics uses historical machine data to forecast network issues like congestion, hardware failures, and capacity shortfalls before they affect users.
Anomaly detection identifies deviations from expected patterns in real time, catching issues that static thresholds miss entirely.
Dynamic baseline alerts adapt to hourly, weekly, and seasonal traffic patterns — reducing false positives and alert fatigue.
Outlier detection pinpoints the one device in a group that's behaving differently from its peers, speeding up root cause isolation.
Smart log parsing uses ML to structure and analyze log data at scale, making logs actionable rather than just archival.
AI-powered monitoring shifts teams from reactive firefighting to proactive network management with automated workflows and intelligent alerting.
How AI and ML Transform Network Performance Monitoring
Self-healing, self-optimizing networks aren't theoretical anymore — they're running in production. AI and machine learning bring a set of capabilities that fundamentally change how teams monitor, troubleshoot, and optimize network performance.
As Gartner's market guide for AIOps platforms notes, these tools "improve the decision-making process for IT leaders with contextual insight on large volumes of machine data" and "significantly help in automation."
But the real value goes well beyond data processing. Here are the specific AI/ML capabilities that make the difference.
Predictive Analytics: Forecast Issues Before They Hit
AI combined with machine learning studies historical machine data — traffic patterns, device performance trends, error rates — and uses that context to predict what's likely to happen next.
Instead of waiting for a link to saturate or a device to fail, predictive analytics gives your team advance warning. Past trends inform future forecasts, and the models improve over time as they ingest more data. For network teams, this means fewer surprise outages and more time to plan capacity upgrades or maintenance windows.
Use case: A predictive model flags that a core switch's CPU utilization has been trending upward every quarter-end for the past three cycles. The team schedules a firmware update and load redistribution before the next quarter closes — avoiding a potential outage during peak traffic.
Anomaly Detection: Catch Deviations in Real Time
Anomaly detection in a network monitoring tool alerts users whenever a metric deviates from an expected pattern. Unlike static thresholds that trigger on fixed values, anomaly detection learns what "normal" looks like for each metric and flags when behavior drifts outside that range.
The detection algorithms can range from basic statistical methods to more flexible approaches depending on the vendor's implementation. The key advantage is that anomaly detection catches the problems that static thresholds miss — subtle degradations, unusual traffic spikes, or slow-burn issues that don't cross a hard limit but still indicate trouble.
Use case: A WAN link shows a gradual increase in latency that stays below the static 100ms threshold. Anomaly detection catches the drift because the link's normal baseline is 25ms — flagging the issue days before it impacts application performance.
Baseline Alerts: Dynamic Thresholds That Adapt
AI-powered monitoring platforms offer the flexibility to set up baselines across different time windows — hourly, weekly, or monthly. When a metric violates its baseline (crossing the defined threshold value), the tool generates an alert.
The best network performance monitoring tools let you configure thresholds using absolute values, percentages, or both — with configurable occurrence counts to filter out transient spikes. This approach dramatically reduces alert fatigue because the thresholds reflect actual operating patterns rather than arbitrary static values.
Use case: A data center network sees 40% higher bandwidth usage every Monday morning as employees sync files and start VMs. Baseline alerts account for this pattern and only fire if Monday usage exceeds the learned Monday baseline — not the Tuesday baseline.
Outlier Detection: Spot the Odd Device Out
Outlier detection identifies when one member of a device group behaves differently from its peers. It's essentially pinpointing the odd one out — not in subjective terms, but based on measurable deviations in performance metrics.
Under the hood, vendors typically implement algorithms like DBSCAN, MAD, SCALEDDBSCAN, and SCALEDMAD to identify statistical outliers within grouped device data. This capability is especially valuable for large environments where manually comparing hundreds of similar devices is impractical.
Use case: Across a fleet of 200 access points, one AP shows significantly higher packet loss than the rest. Outlier detection flags it immediately, and the team discovers a failing radio module — before users start reporting Wi-Fi issues.
Capacity Forecasting: Plan Ahead with ML Models
Forecasting takes predictive analytics a step further by estimating when a specific metric is likely to cross a defined threshold in the near future. The algorithms used — typically linear or seasonal models — project trends based on historical data and current trajectories.
This gives network teams a planning tool, not just an alerting tool. Capacity forecasting helps justify hardware purchases, schedule upgrades, and avoid the "we ran out of bandwidth on a Friday afternoon" scenarios that disrupt operations.
Use case: ML-based forecasting projects that the primary internet link will reach 90% utilization within 45 days based on current growth trends. The team procures additional bandwidth before the threshold is breached.
Smart Log Parsing: ML-Powered Log Analysis
Machine learning brings log parsing capabilities that go beyond keyword searches and regex patterns. ML-based log parsers can automatically structure unstructured log data, identify patterns across log sources, and surface the entries that matter most.
Modern platforms provide out-of-the-box log parsers for common formats and let teams build custom parsers through a UI — no scripting required. This makes logs a proactive monitoring input rather than a forensic afterthought.
Use case: A syslog parser trained on a network's log patterns identifies a new error message pattern appearing across multiple switches. The ML engine correlates it with a recent firmware update and surfaces it as a potential issue — before any performance degradation shows up in metrics.
Why Traditional Monitoring Tools Aren't Enough
With AI and ML capabilities now available in production monitoring platforms, the gap between legacy tools and modern solutions keeps widening. Legacy tools work fine for static environments with predictable workloads. But when networks grow with cloud adoption, IoT devices, and hybrid infrastructure, rule-based monitoring can't keep up.
The shift isn't about replacing human judgment — it's about giving network teams better signal from the noise. AI handles the pattern recognition and data correlation at scale; humans make the decisions about what to do with those insights.
Organizations that stick with legacy monitoring architectures aren't wrong — but they're accepting more operational risk and higher mean time to resolution than they need to.
Choosing an AI-Powered Network Monitoring Platform
Not every tool that claims AI capabilities delivers real value. When evaluating AI-powered network monitoring tools, look for:
Proven anomaly detection with configurable sensitivity and multiple algorithm options.
Predictive and forecasting capabilities backed by ML models that improve with your data.
Dynamic baselining across multiple time windows with occurrence-based alert filtering.
Integrated log parsing with both out-of-the-box and custom parser support.
Unified observability that combines metrics, logs, and traces in a single platform.
ITSM integration for automated ticket creation and workflow handoffs.
Why Motadata for AI-Powered Network Monitoring
Motadata's AI-native AIOps platform delivers every capability covered in this guide — predictive analytics, anomaly detection, dynamic baselining, outlier detection, and ML-powered log parsing — in a single, integrated monitoring solution. It's built to handle hybrid environments where on-premises infrastructure meets cloud workloads, and it integrates directly with Motadata ServiceOps for automated ticket creation and incident workflows. If you're ready to move past static thresholds and reactive alerting, start a free trial and see AI-powered network monitoring in action.
FAQs
How do AI and ML enhance network performance monitoring?
AI and ML automate anomaly detection, predict network failures, optimize resource allocation, and improve response times by analyzing large volumes of network data. They turn monitoring from a reactive activity into a proactive capability.
What are the benefits of using AI/ML in network monitoring?
Key benefits include faster issue resolution, proactive network management, stronger security posture, reduced downtime, and better decision-making through predictive insights. Teams spend less time on alert triage and more time on strategic work.
What metrics can AI/ML track in network monitoring?
AI/ML tools monitor metrics such as bandwidth usage, latency, packet loss, uptime, CPU and memory utilization, and device health. They also analyze logs, flow data, and SNMP traps to provide comprehensive network performance visibility.
How does AI-powered monitoring reduce false positives?
AI-powered tools learn normal behavior patterns for each metric and device through dynamic baselining. They use occurrence-based thresholds and correlation algorithms to filter out transient spikes, only alerting when genuine anomalies are detected.
What should I look for in an AI-powered network monitoring tool?
Look for proven anomaly detection, predictive analytics, dynamic baselining, integrated log parsing, unified observability across metrics and logs, and ITSM integration for automated incident workflows.