All Features
Log Monitoring
Log Aggregation
Transform your log management capabilities with Motadata ObserveOps to experience efficiency and receive insights like never before. Our log aggregation abilities are designed to handle diverse log sources and large volumes of data effortlessly, in a vendor-agnostic manner, thus empowering your IT infrastructure monitoring and management with real-time intelligence and robust log analysis tools.
What is Log Aggregation?
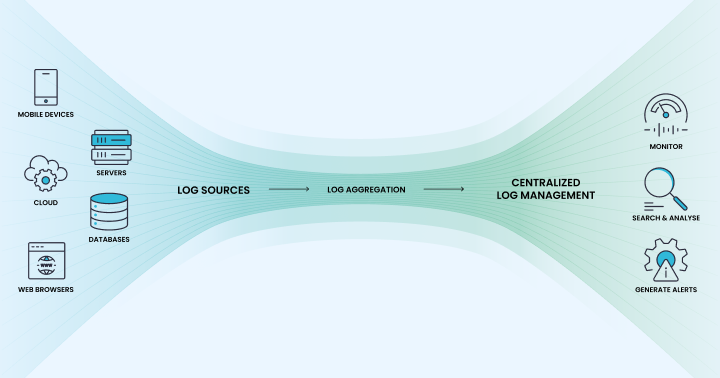
Log aggregation identifies log sources, collects data, and consolidates the logs at a central location.
From the perspective of modern IT infrastructure, Log aggregation is crucial to bringing structure into unstructured raw log data, enabling logs as a medium for multiple use cases, such as efficient infrastructure and performance monitoring, troubleshooting, analysis, and even identification of security issues.
Why is Log Aggregation Important?
Log Aggregation is more than just a technical necessity. It’s a strategic approach that yields significant benefits:
1. Streamlining and Standardizing Logs:
Log aggregation reduces complexity by streamlining log management, consolidating logs from various sources with different formats, and standardizing them into a common format.
2. Enhancing System Performance through Insights:
Aggregated log data enables administrators to gain valuable insights into performance issues and resource utilization in system and application performance.
3. Improving Security Posture:
Log aggregation enables organizations to improve their security posture by actively monitoring and identifying potential threats and malicious activities.
4. Log Management, Monitoring, and Analysis:
Log Aggregation enables a unified approach to log management by enabling platforms to collect, aggregate, store, monitor, and analyze the logs from a centralized location.
5. Efficient Troubleshooting and Resolving Incidents in Production:
Aggregated logs enable quick identification and resolution of incidents by allowing a holistic view of system operations.
How Log Aggregation Works?
There are several steps involved in aggregating logs into a central repository, which can be described as follows:
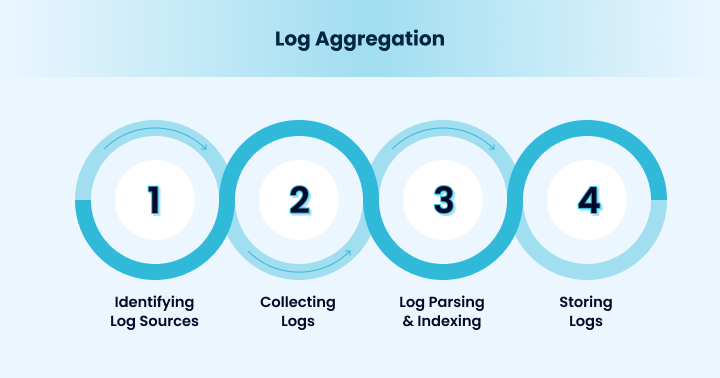
1. Identifying Log Sources: Modern Infrastructure has a diverse range of logs. As a first step, it is vital to identify the different sources you need to aggregate the logs for analysis.
2. Collecting Logs: Logs can be collected from various sources, such as applications, databases, network devices, web servers, OSs, and more, using methods such as file ingestion, Syslog, or automated pipelines.
3. Log Parsing & Indexing: After the logs are collected, they must be parsed to gain meaningful insights.
4. Storing Logs: The parsed logs are then consolidated and stored at a central location to facilitate retrieval and enable further analysis and log management.
You can also use a unified platform such as Motadata ObserveOps, which can perform all the necessary log aggregation steps and much more by directly accessing log sources, ingesting logs from diverse sources, parsing and aggregating them into a central location for log management & analysis.
Challenges and Considerations
1. Log Volumes:
One significant challenge in log aggregation is managing the large volumes of logs in modern infrastructure. As organizations scale, the sheer volume of log data grows exponentially, making it difficult to collect, store, and analyze it.
2. Log Data Complexity:
Aggregating logs from diverse sources can be challenging. The logs are generated in different formats, which require parsing them to align them in the same format. This can lead to increased overhead for organizations.
3. Log Data Privacy and Security:
Log data can sometimes be sensitive and entail strict regulatory and compliance requirements, as they pose privacy and security concerns. It is vital to ensure that the logs are securely stored, transmitted, and accessed for analysis to ensure data privacy and security.
Unlock the Potential of your Log data with Motadata ObserveOps’ Log Aggregation
Let us look into what you get with Motadata ObserveOps’ cutting-edge Log Aggregation:

1. Centralized Log Management: Manage all the logs in your infrastructure from one unified platform. This makes it easier and more efficient to access, search, and analyze log data.
2. Advanced Analytics: Utilize cutting-edge tools such as the Log Explorer to filter, search, and correlate log data. This facilitates a comprehensive analysis of log events, enabling you to identify historical trends and predict future behavior.
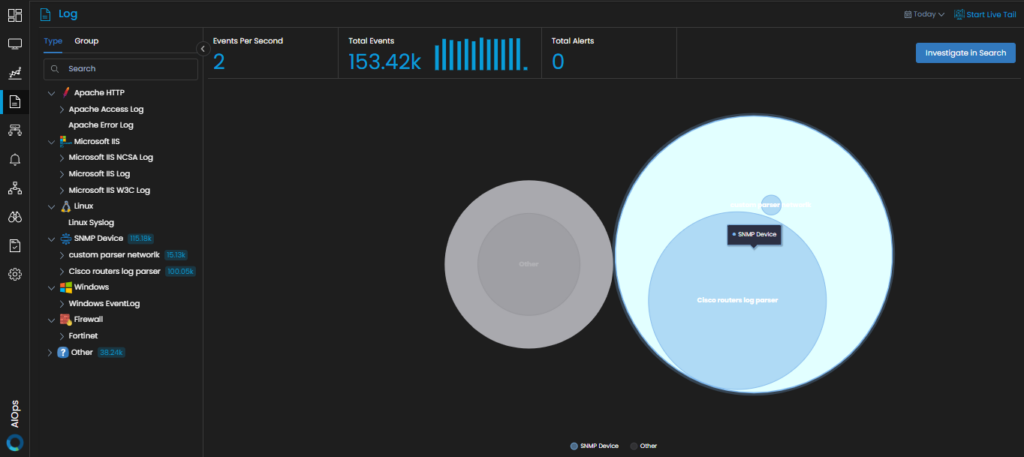
3. Intuitive Dashboard: The user-friendly and easy-on-the-eye dashboard provides a diverse range of visual representations such as Chart, Grid, Top N, and more to suit your needs. This Intuitive dashboard allows quick monitoring and analysis to enable on-the-go troubleshooting and resolution.
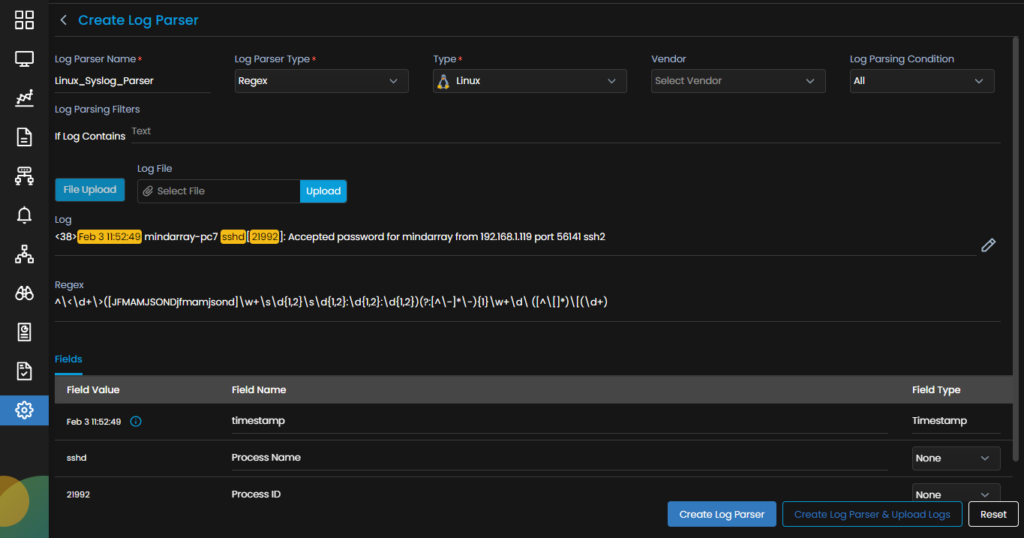
4. Pre-built Parsers: Benefit from a library of pre-configured Out-of-the-box parsers for popular servers, applications, and network devices, including Microsoft, Apache, IIS, Firewall, etc., across vendors. These parsers ensure accurate log interpretation with minimal manual intervention.
5. Customizable Parsing Rules: You can parse logs to your specific needs by creating custom parsers. This flexibility allows you to tailor log parsing to support diverse log formats and meet specific requirements at the same time.
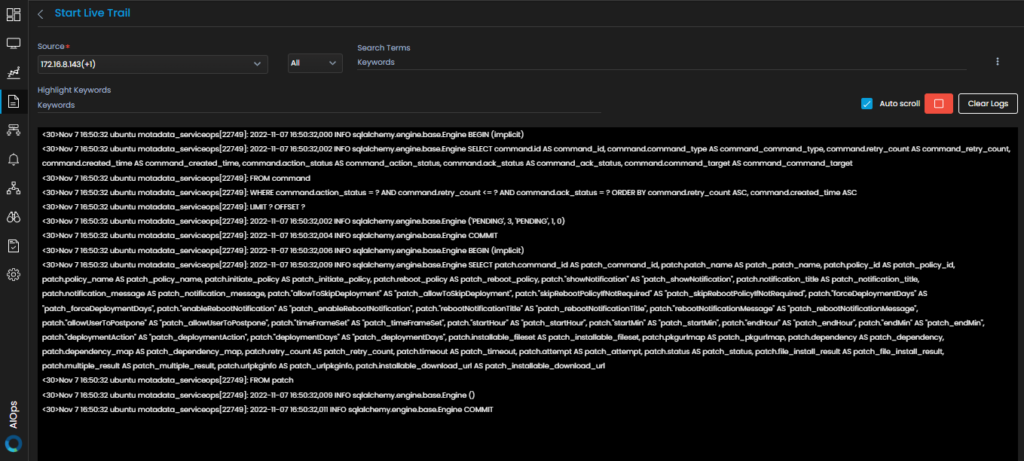
6. Live Log Trail: Leverage the Live Log Trail feature that facilitates real-time log monitoring as it allows you to view live log data as it is generated. This helps to promptly detect and address issues as they occur.
7. Proactive Alerting: The platform support proactive alerting with both inbuilt and customizable alerting capabilities for critical log events. This would ensure that you get a hold of potential issues before they escalate.
8. Log Pattern Matching: The platform identifies patterns and trends in log data by clustering similar logs together using machine-learning powered log pattern matching. This aids to detect trends and at the same time helps to detect the anomalies and troubleshooting issues efficiently.
9. Scalability: With the volume of logs increasing exponentially and the infrastructure becoming more and more complex, Motadata AIOps is adept at scaling to your needs without compromising performance.
In this way, Motadata ObserveOps enhances your log management capabilities, providing a comprehensive solution for monitoring, analyzing, and managing log data efficiently.
Ready to implement Log Aggregation?
Discover how Motadata AIOps can help you monitor your infrastructure in real-time and respond to issues instantly.