Infrastructure Monitoring for Business Operations: Why It Matters and How to Get Started
Infrastructure monitoring is the practice of continuously tracking the performance, availability, and health of an organization's IT infrastructure -- including servers, networks, applications, virtual machines, and cloud resources -- using automated tools that provide real-time visibility and alerting.
It's 2:47 AM. Your e-commerce platform's checkout flow just stopped responding. Customers in three time zones are getting timeout errors. Your on-call engineer's phone hasn't rung because nobody configured alerts for the database connection pool that just exhausted itself.
By the time your team discovers the issue through a customer complaint six hours later, you've lost revenue, damaged customer trust, and triggered an SLA breach with your largest enterprise client.
Infrastructure monitoring exists to prevent exactly this scenario. It doesn't just tell you when something breaks -- it tells you when something is about to break, giving your team the time to fix issues before users ever notice.
What Is Infrastructure Monitoring?
Infrastructure monitoring is the continuous process of collecting, analyzing, and acting on performance data from every component in your IT environment. It covers physical servers, virtual machines, network devices, storage systems, applications, and cloud services.
The goal is straightforward: maintain full visibility into how your infrastructure is performing so you can identify problems early, resolve them fast, and make informed decisions about capacity, optimization, and investment.
Modern infrastructure monitoring tools go beyond simple up/down checks. They collect granular metrics, correlate data across infrastructure layers, establish performance baselines, and use AI to detect anomalies that static thresholds would miss.
For IT teams, this means spending less time firefighting and more time on the strategic work that actually moves the business forward.
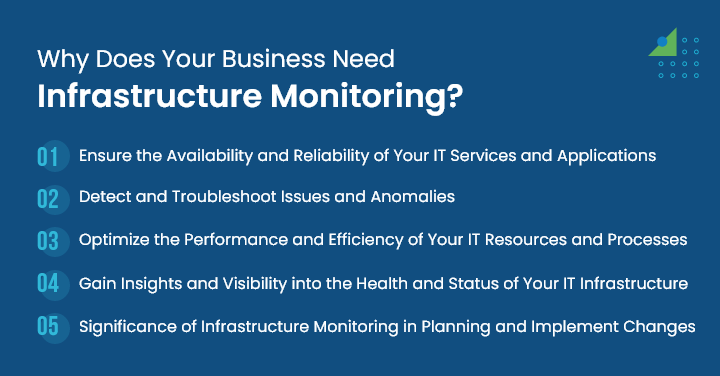
Why Your Business Needs Infrastructure Monitoring
Prevent Downtime Before It Happens
The 2017 AWS S3 outage took down hundreds of websites and services for hours -- and it started with a single human error. Unplanned downtime happens to every organization eventually. The difference is whether you detect the warning signs in time to prevent the outage or learn about it from angry customers.
Infrastructure monitoring tools track health metrics continuously and alert your team when thresholds are breached or when anomalous patterns emerge. This proactive approach turns potential outages into minor performance events that get resolved during business hours, not at 3 AM.
Detect and Resolve Issues Before Customers Notice
Monitoring tools collect data from servers, network devices, applications, and log files simultaneously. By correlating data across these sources, they identify issues -- a memory leak, a degrading disk, a network bottleneck -- before they cascade into customer-facing failures.
The ability to troubleshoot issues at an early stage is what separates high-performing IT operations teams from reactive ones.
Optimize Resource Utilization and Costs
Without monitoring, you're guessing about capacity. Are your servers overprovisioned or running hot? Is your network bandwidth adequate for current demand? Are you paying for cloud instances that sit idle 90% of the time?
Infrastructure monitoring provides the data you need to answer these questions with precision. It identifies underutilized resources (candidates for right-sizing), bottlenecks (candidates for upgrades), and waste (candidates for decommissioning). The result is infrastructure that's sized correctly for actual demand -- not estimated demand.
Full Visibility Across Your Entire Stack
Modern IT environments span on-premises data centers, public clouds, private clouds, and hybrid configurations. Without unified monitoring, your team operates with blind spots -- issues in one environment that affect performance in another go undetected until they become incidents.
A comprehensive monitoring platform provides a single view across all environments, showing the interdependencies between components and the health of every layer in your stack.
Data-Driven Capacity Planning
Infrastructure monitoring data doesn't just help with incident response -- it enables strategic planning. Usage trends, performance baselines, and growth projections inform decisions about when to scale, what to upgrade, and where to invest.
Whether you're planning for seasonal traffic spikes, evaluating a cloud migration, or justifying infrastructure investment to the board, monitoring data provides the evidence base for confident decisions.
Types of Infrastructure Monitoring
Different components of your infrastructure require different monitoring approaches. A comprehensive strategy covers all of them.
Server Monitoring
Tracks CPU utilization, memory usage, disk I/O, process health, and system load across physical and virtual servers. Server monitoring alerts you when resources approach capacity limits or when processes fail.
Network Monitoring
Monitors network bandwidth, latency, packet loss, device availability, and traffic patterns. Network monitoring identifies bottlenecks, detects unauthorized traffic, and ensures connectivity across your environment.
Application Performance Monitoring (APM)
Measures response times, error rates, throughput, and user experience for business-critical applications. APM goes beyond infrastructure health to show how the infrastructure layer affects actual application performance.
Cloud Infrastructure Monitoring
Tracks resource utilization, cost, performance, and availability across AWS, Azure, GCP, and multi-cloud environments. Cloud monitoring addresses the unique challenges of dynamic, auto-scaling infrastructure where resource inventory changes constantly.
Database Monitoring
Monitors query performance, connection pools, replication lag, storage consumption, and availability for database systems. Database issues are one of the most common causes of application performance problems.
Log Monitoring
Collects and analyzes log data from across your infrastructure to identify errors, security events, and operational anomalies. Log monitoring provides the detailed diagnostic data teams need for root cause analysis.
Key Metrics to Track
Effective monitoring focuses on the metrics that actually predict problems and inform decisions.
Metric | What It Measures | Why It Matters |
|---|---|---|
CPU Utilization | Processing capacity in use | Sustained high CPU signals bottlenecks or undersized infrastructure |
Memory Usage | RAM consumption per instance | Memory pressure causes application slowdowns and crashes |
Disk I/O | Read/write performance | Slow disk I/O degrades database and application performance |
Network Latency | Delay between request and response | Directly impacts user experience, especially across distributed systems |
Error Rate | Frequency of failed requests | Rising error rates signal deeper infrastructure or application issues |
Response Time | How fast services respond | The metric users feel most directly |
Availability/Uptime | Percentage of time services are operational | Directly tied to SLA commitments and customer trust |
Throughput | Volume of transactions processed | Identifies capacity limits and performance ceilings |
Track these metrics against historical baselines, not arbitrary thresholds. An 80% CPU utilization that's normal for your workload pattern shouldn't trigger the same alert as an unexpected spike from 40% to 80%.
Infrastructure Monitoring Best Practices
Define Monitoring Objectives Before Deploying Tools
Don't start with the tool -- start with the question. What are you trying to protect? Which systems are most critical to business operations? What SLAs do you need to meet? Clear objectives determine what you monitor, how you alert, and who responds.
Implement Intelligent Alerting
Alert fatigue is a real problem. If your team receives hundreds of alerts per day, they'll start ignoring them -- including the ones that matter. Use dynamic baselines and AI-driven anomaly detection to generate alerts that indicate actual problems, not normal variations. Route alerts to the right team based on the affected system and severity.
Correlate Data Across Infrastructure Layers
An application slowdown might be caused by a database issue, which is caused by a storage I/O bottleneck, which is caused by a failing disk. Siloed monitoring that only shows you the application layer tells you there's a problem but not why. Cross-layer correlation connects the dots automatically.
Monitor Proactively, Not Reactively
Proactive monitoring means using trend analysis and predictive analytics to identify problems before they become incidents. If disk usage is growing 3% per week, you know you'll hit capacity in a specific timeframe. If response times are gradually increasing, you can investigate before they breach SLA thresholds.
Automate Remediation for Known Issues
For well-understood problems with documented solutions, automate the fix. Restart a failed service automatically. Scale infrastructure when utilization exceeds thresholds. Clear disk space when volumes approach capacity. Automation reduces MTTR and frees your team for complex investigations that require human judgment.
Infrastructure Monitoring vs. Observability
Infrastructure monitoring and observability are related but distinct concepts. Understanding the difference helps you build the right strategy.
Aspect | Monitoring | Observability |
|---|---|---|
Approach | Tracks known metrics against thresholds | Explores system behavior through metrics, logs, and traces |
Question | "Is this metric within acceptable range?" | "Why is the system behaving this way?" |
Scope | Predefined dashboards and alerts | Ad-hoc investigation of unknown issues |
Best for | Known failure modes and SLA tracking | Complex, distributed systems with unpredictable failure modes |
In practice, you need both. Monitoring catches the problems you anticipate. Observability helps you diagnose the ones you didn't.
How Motadata Delivers AI-Native Infrastructure Monitoring
Managing infrastructure across servers, networks, cloud environments, and applications requires a monitoring platform that unifies all of it -- not a collection of disconnected tools that each show a different piece of the picture.
Motadata's AI-native infrastructure monitoring platform provides a single dashboard across your entire IT environment. With intelligent anomaly detection, automated root cause analysis, and predictive alerting, your team identifies and resolves issues before they impact users. Whether you're monitoring on-premises servers, AWS instances, Azure resources, or hybrid environments, Motadata gives you the visibility you need to maintain performance, meet SLAs, and plan capacity with confidence.
Start a free trial to see how Motadata brings AI-driven infrastructure monitoring to your business operations.
FAQs
What is infrastructure monitoring?
Infrastructure monitoring is the continuous process of tracking the performance, health, and availability of IT infrastructure components -- servers, networks, storage, virtual machines, applications, and cloud resources. It uses automated tools to collect metrics, detect anomalies, generate alerts, and provide the visibility teams need to maintain reliable operations.
Why is infrastructure monitoring important for business?
Because downtime costs money, damages customer trust, and violates SLAs. Infrastructure monitoring detects issues early -- often before they become customer-facing problems -- and provides the data teams need to resolve them quickly. It also enables capacity planning, cost optimization, and compliance documentation.
What tools are used for infrastructure monitoring?
Infrastructure monitoring tools range from open-source options (Nagios, Zabbix, Prometheus) to enterprise platforms (Motadata, Datadog, Dynatrace). The right choice depends on your environment's complexity, scale, and integration requirements. AI-native platforms like Motadata are increasingly preferred for their ability to detect anomalies without manual threshold configuration.
How does infrastructure monitoring reduce downtime?
By detecting performance degradation, resource exhaustion, and anomalous behavior before they cause outages. Monitoring tools alert teams to problems early, provide diagnostic data for fast root cause analysis, and can trigger automated remediation for known issues -- all of which reduce both the frequency and duration of downtime events.
What's the difference between infrastructure monitoring and observability?
Monitoring tracks predefined metrics and alerts when thresholds are breached -- it answers "is something wrong?" Observability goes deeper, combining metrics, logs, and traces to answer "why is something wrong?" You need monitoring for known failure modes and SLA tracking, and observability for diagnosing complex, unpredictable issues in distributed systems.
Author
Motadata Team
Content Team
Articles produced collaboratively by our engineering and editorial teams bear the collective authorship of Motadata Team.


: 7 Myths Debunked and What Modern FIM Actually Does")