Solaris
Monitors and manages Solaris systems in Motadata AIOps by delivering real-time insights into performance, resource utilization, and system health to ensure efficient and uninterrupted operations.
Overview
Solaris, the robust operating system developed by Oracle, finds seamless integration with Motadata AIOps. This integration facilitates comprehensive monitoring and management of Solaris servers, offering real-time insights into performance metrics, system logs, and the overall health of the infrastructure. With proactive issue detection, resource optimization, and streamlined operations, critical business processes can run efficiently and without interruption.
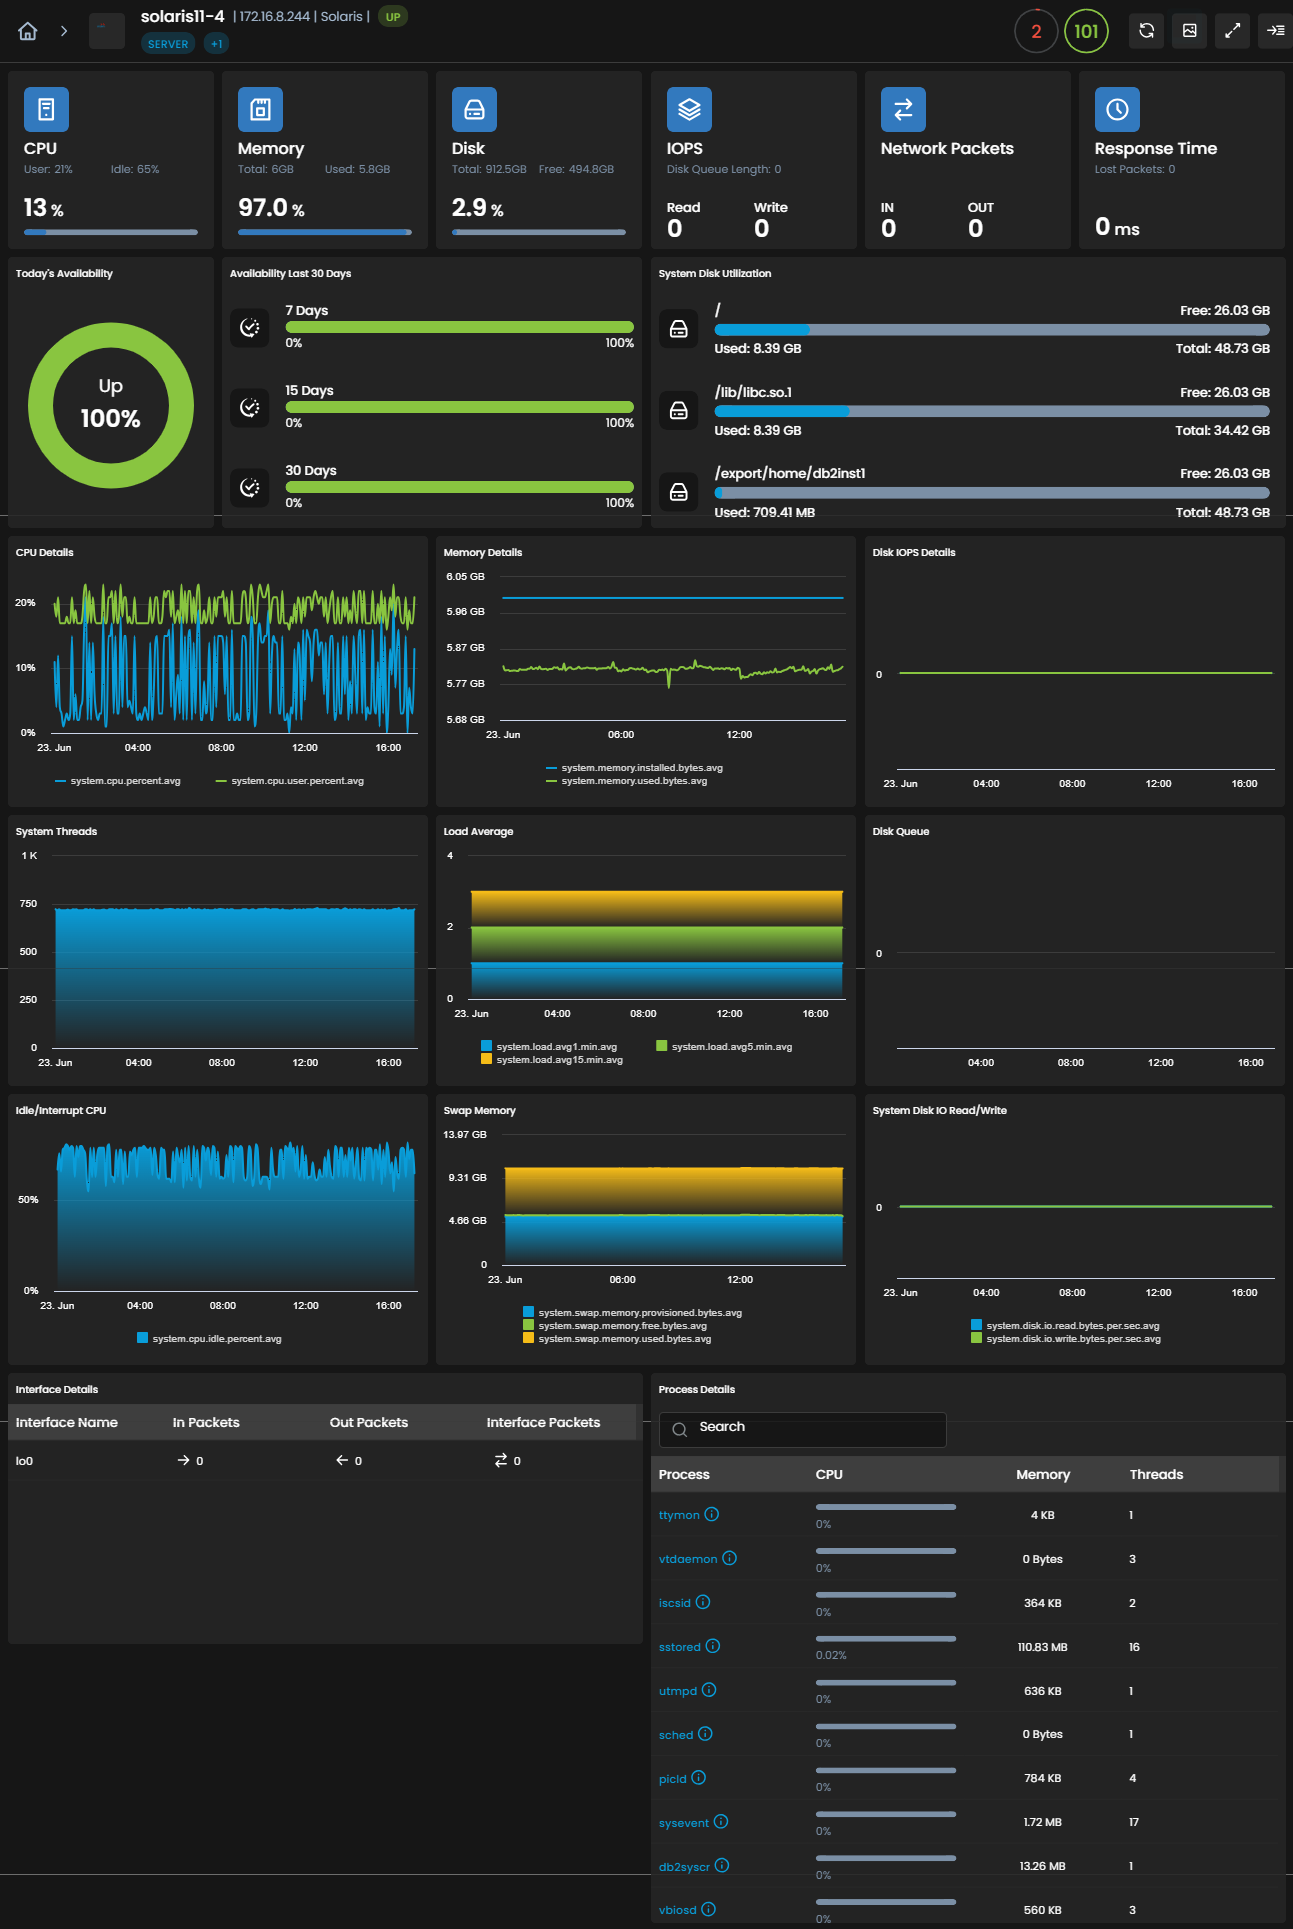
List of Supported KPIs
Solaris
Metrics | Description | Type |
|---|---|---|
system.network.out.packets.rate | Number of packets being transferred out of the device per second. | Rate |
system.network.in.packets.rate | Number of packets being transferred in to the device per second. | Rate |
system.network.packets.rate | Number of packets being transferred in or out of the device per second. | Rate |
system.network.udp.connections | The total count of UDP connections in the network. | Count |
system.network.tcp.connections | The total count of TCP connections in the network. | Count |
system.network.error.packets | The total number of error packets in a network. | Count |
system.cpu.idle.percent | The percentage of time the CPU has spent idle. | Percentage |
system.cpu.user.percent | The percentage of time the CPU spent running user space processes. | Percentage |
system.cpu.percent | The percentage of a CPU being utilized at a particular instance. | Percentage |
system.cpu.type | String | |
system.disk.used.percent | The percentage of used disk space out of the total disk space on a system. | Percentage |
system.disk.capacity.bytes | The capacity of the disk. | Count |
system.disk.free.bytes | The total amount of free disk space available on a system. | Count |
system.disk.used.bytes | The total amount of used disk space on a system. | Count |
system.disk.io.bytes.per.sec | The amount of bytes transferred doing I/O operations to and from the disk per second. | Rate |
system.disk.io.write.bytes.per.sec | The bytes transferred per second writing to the disk. | Count |
system.disk.io.read.ops.per.sec | The number of read operations per second from the disk. | Count |
system.running.processes | The total number of running processes in the system. | Count |
system.name | The name of the device. | String |
system.disk.io.read.bytes.per.sec | The number of bytes transferred while reading from the disk per second. | Rate |
system.disk.io.write.ops.per.sec | The writing operations to the disk per second. | Rate |
system.threads | The total number of CPU threads. | Count |
uptime.sec | The time for which the system has been available. | Count |
uptime | String | |
system.os.version | The version of the operating system on your host. | String |
system.logical.processors | the number of logical processors on the device CPU. | Count |
system.memory.installed.bytes | Count | |
system.memory.free.bytes | The total amount of free RAM space on a system. | Bytes |
system.disk.io.ops.per.sec | The number of read-write operations per second on the device. | Count |
system.disk.io.queue.length | The queue length of IO requests issued to your device. | Count |
system.memory.used.bytes | The total amount of used RAM on a system. | Bytes |
system.memory.used.percent | The percentage of used RAM out of total RAM. | Percent |
system.network.tcp.retransmissions | The count of lost or damaged packets that were resent over the network. | String |
Solaris CPU Core
Metrics | Description | Type |
|---|---|---|
system.cpu.core | Index to identify the CPU core. | String |
system.cpu.core.user.percent | The percentage of CPU core being utilised by the user. | Percent |
system.cpu.core.idle.percent | The percentage of time a particular CPU core has spent in idle state. | Percent |
system.cpu.core.percent | The percentage of a CPU core being utilized at a particular instance. | Percent |
Solaris Disk
Metrics | Description | Type |
|---|---|---|
system.disk.read.ops.per.sec | The reading operations performed on the disk per second. | Rate |
system.disk.write.ops.per.sec | The writing operations performed on the disk per second. | Rate |
system.disk.ops.per.sec | The I/O operations per second on the disk. | Rate |
system.disk.read.bytes.per.sec | The bytes transferred per second reading from the disk. | Rate |
system.disk.write.bytes.per.sec | The bytes transferred per second writing to the disk. | Rate |
system.disk.bytes.per.sec | The bytes transferred doing I/O operations to and from the disk per second. | Rate |
system.disk.queue.length | The queue length of IO requests issued to your device. | Count |
system.disk.volume | The label of the disk volume. | String |
system.disk.volume.free.bytes | The amount of free disk space. | Bytes |
system.disk.volume.used.bytes | The amount of used disk space. | Bytes |
system.disk.volume.capacity.bytes | The capacity of the disk. | Bytes |
system.disk.volume.used.percent | The percentage of used disk space out of the total disk space on a system. | Percent |
Solaris Network Interface
Metrics | Description | Type |
|---|---|---|
system.network.interface | The name of the interface | String |
system.network.interface.in.packets.rate | the number of packets transferred into an interface per second. | Count |
system.network.interface.out.packets.rate | the number of packets transferred out of an interface per second. | Count |
system.network.interface.packets.rate | The number of packets transferred in or out of an interface per second. | String |
interface.error.packets | The total number of error packets sent and received on an interface. | Count |
system.network.interface.packet.loss.percent | The percentage of packets lost out of total packets transferred over an interface. | Count |
Solaris Process
Metrics | Description | Type |
|---|---|---|
system.process | The name of the process. | String |
system.process.handles | The number of handles used by a process. | Count |
system.process.memory.used.bytes | The total space used in a RAM by a process. | Count |
system.process.virtual.memory.bytes | The amount of virtual memory used by a process. | Count |
system.process.id | The process Id. | Count |
status | The status of the process. Up if the process is available for monitoring and down if the process is not available for monitoring | String |
system.process.cpu.percent | The CPU utilization of a process. | Count |
system.process.threads | The number of threads used by this process. | Count |
system.process.uptime | The total time for which the process is in runnning state. | String |
system.process.uptime.sec | The total time in seconds for which the process is running. | Count |
system.process.memory.used.percent | The percentage of RAM allocated for use by a process. | Percentage |
system.process.user | The name of the user that started the process. | String |
system.process.command | The command to identify the status of the process. | String |
system.process.source.ip | The source IP from which the process communicates. | String |
system.process.source.port | The source port from which the process communicates. | Count |
system.process.destination.ip | The destination IP to which the process communicates. | String |
system.process.destination.port | The destination port to which the process communicates. | Count |
system.process | The name of the process. | String |
Explore More Integrations
Browse our comprehensive integrations catalog to discover all supported platforms and services.