Turbocharge Your MSP with Motadata's Unified Product Suite
Managed service providers operate in one of IT's most demanding business models. You're responsible for keeping your clients' infrastructure running, their tickets resolved, and their SLAs met — all while managing your own profitability. The margin between a thriving MSP and one that's barely breaking even often comes down to operational efficiency: how well you track technician time, how fast you detect and resolve issues, and how effectively you turn service delivery data into business decisions.
The challenge intensifies as MSPs scale. Adding clients means adding complexity — more devices to monitor, more tickets to manage, more SLAs to honor. Without a unified platform that handles both IT service management and network monitoring from a single pane of glass, MSPs end up juggling disconnected tools, duplicating effort, and losing visibility into the metrics that matter most.
This guide breaks down how Motadata's AI-native unified product suite addresses the core challenges MSPs face across service delivery, network operations, and business profitability.
What Makes MSP Operations Uniquely Challenging
A Managed Service Provider (MSP) delivers outsourced IT services — infrastructure management, network monitoring, help desk support, security, and more — to multiple clients under contractual SLAs. This multi-tenant operating model introduces challenges that in-house IT teams don't face: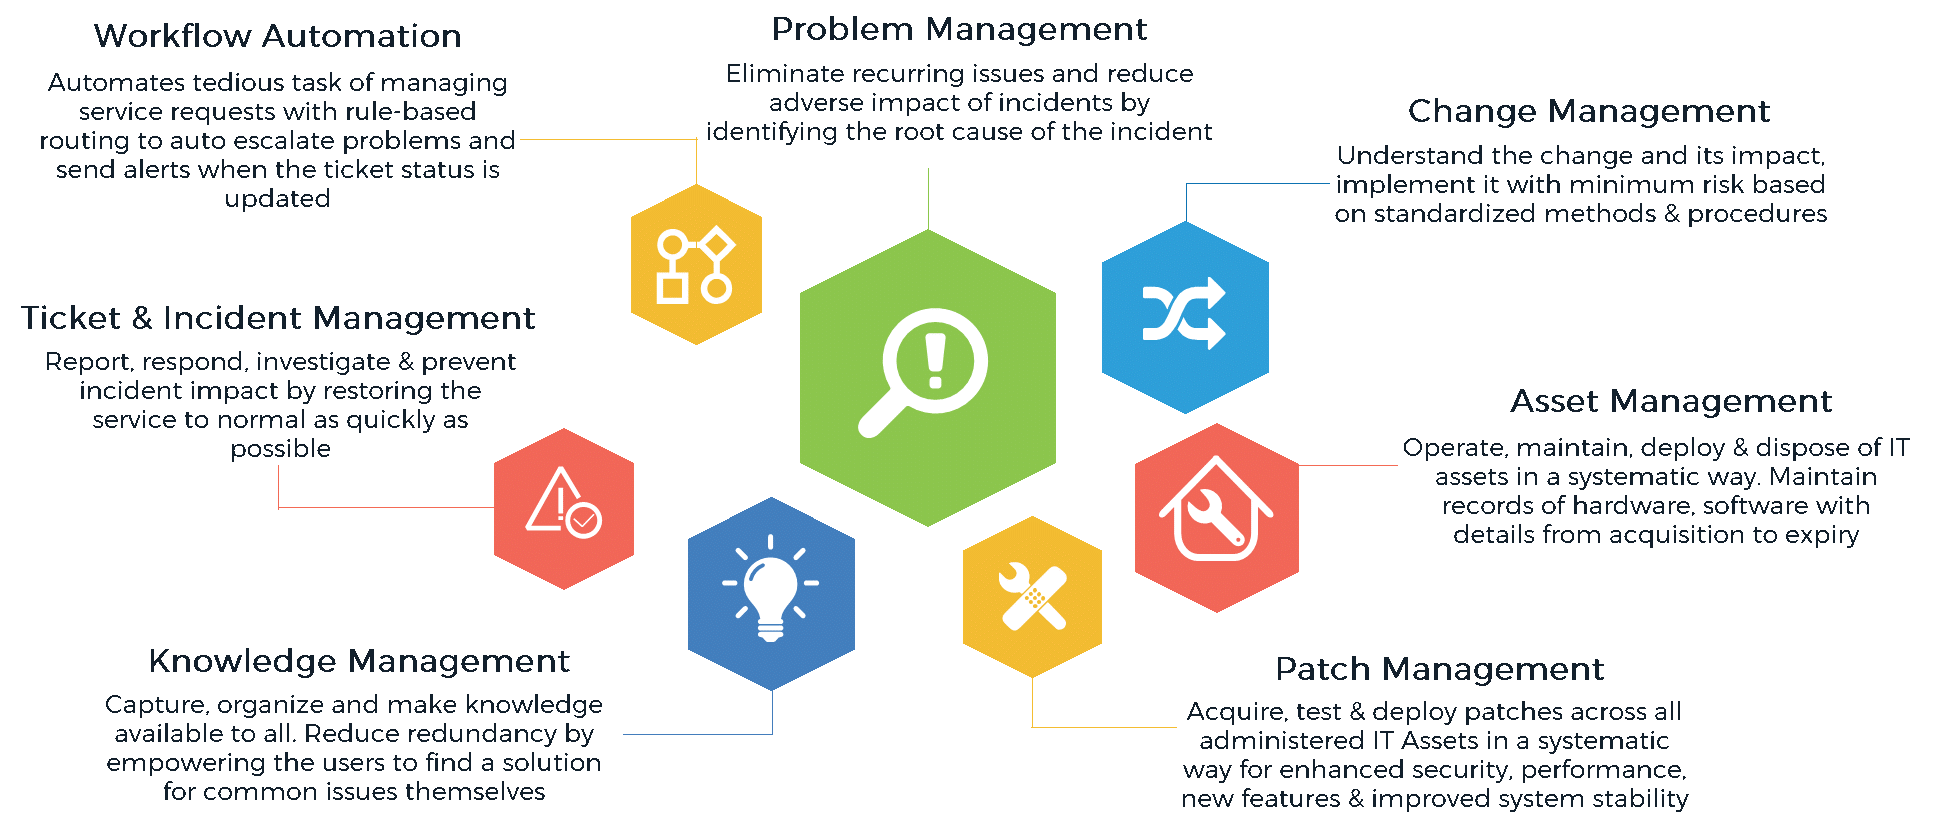
Multi-client complexity — every client has different infrastructure, different SLA terms, and different expectations
Technician utilization pressure — technician time is the primary cost center, and every untracked hour erodes margin
SLA accountability — missed SLAs don't just trigger penalties; they threaten contract renewals and client relationships
Tool proliferation — supporting diverse client environments often leads to managing multiple monitoring and ticketing systems
Scaling without proportional cost — adding clients must increase revenue faster than it increases operational overhead
The MSPs that thrive are the ones that solve these challenges through platform consolidation, automation, and data-driven operations — not by throwing more technicians at the problem.
Turning Technician Time into Measurable Business Value
For any MSP, technician time is the most critical inventory item. Unlike physical products, it can't be stored or recovered once spent. Yet most MSPs lack the granular visibility needed to understand how technician time translates into profitability.
MSPs typically serve two types of clients:
Flat-rate clients — billed monthly regardless of ticket volume. Profitability depends on minimizing technician time per client.
Break-fix clients — billed hourly for each engagement. Profitability depends on accurate time tracking and efficient resolution.
Metrics That Drive MSP Profitability
An intelligent service desk transforms technician activity into actionable business metrics:
Metric | What It Tells You | Business Decision It Enables |
|---|---|---|
Avg. time per ticket | Overall service desk efficiency | Identify process bottlenecks; benchmark against SLA targets |
Avg. time per ticket per technician | Individual technician productivity | Spot training needs; identify top performers for complex clients |
Avg. time per client/device | Client-level cost of service | Identify unprofitable clients; justify pricing adjustments |
Technician availability | Capacity utilization rate | Optimize scheduling; plan hiring based on actual demand |
Revenue minus COGS per client | True client profitability | Make data-driven decisions about contract renewals and pricing tiers |
Motadata's AI-native ServiceOps platform captures these metrics automatically through its ticketing and time-tracking engine. Administrative reports provide drill-down views by technician, client, device category, and time period — giving MSP leadership the data they need for hiring decisions, capacity planning, and premium pricing during high-demand periods.
Proactive Network Monitoring: Preventing Problems Before Clients Notice
Reactive IT support — waiting for clients to report issues — is the fastest path to SLA violations and eroded trust. MSPs need network monitoring that detects anomalies, predicts failures, and triggers alerts before end users experience impact.
The stakes are straightforward: downtime costs clients money, and it costs MSPs contracts.
What MSPs Need from a Network Monitoring Platform
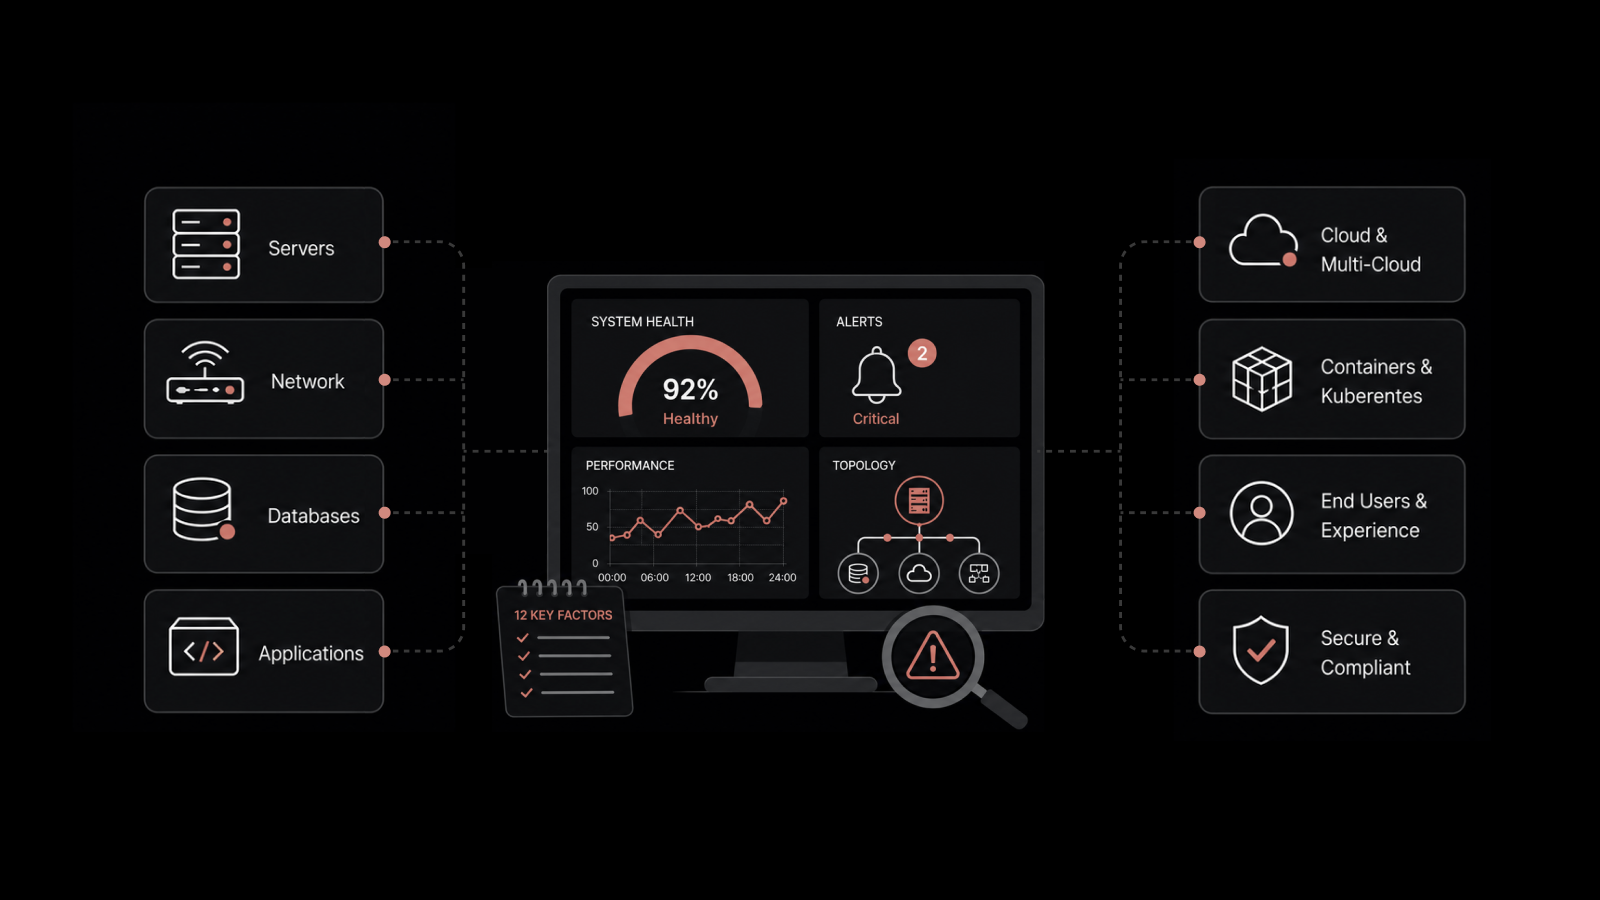
Multi-layer infrastructure visibility from a single dashboard. Every client's environment is different — from OS-level metrics to network device health to application performance. An MSP's monitoring platform must handle this diversity without requiring separate tools for each layer.
Motadata's Network Monitoring System provides unified visibility across servers, switches, routers, firewalls, virtual machines, and cloud resources. Its AI-driven baseline engine learns normal behavior patterns for each client's infrastructure and flags deviations before they escalate into incidents.
SLA-aligned alerting and reporting. MSPs are bound by contractual SLAs, and every alert that goes unacknowledged or unresolved within the agreed window creates financial and reputational risk. The monitoring platform must integrate directly with the service desk to auto-create tickets, assign them based on SLA priority, and trigger escalations when response times are at risk.
Remote infrastructure access. MSPs can't afford to send technicians on-site for every issue. Remote monitoring and management capabilities — including remote access to client infrastructure metrics, real-time dashboards, and automated remediation — eliminate unnecessary site visits and keep technicians productive.
AI-Driven Operations: The MSP Competitive Advantage
The MSPs that pull ahead of their competitors aren't just monitoring infrastructure — they're applying AI to transform raw telemetry into actionable intelligence. This is where Motadata's AI-native architecture delivers a structural advantage.
Intelligent Alert Correlation
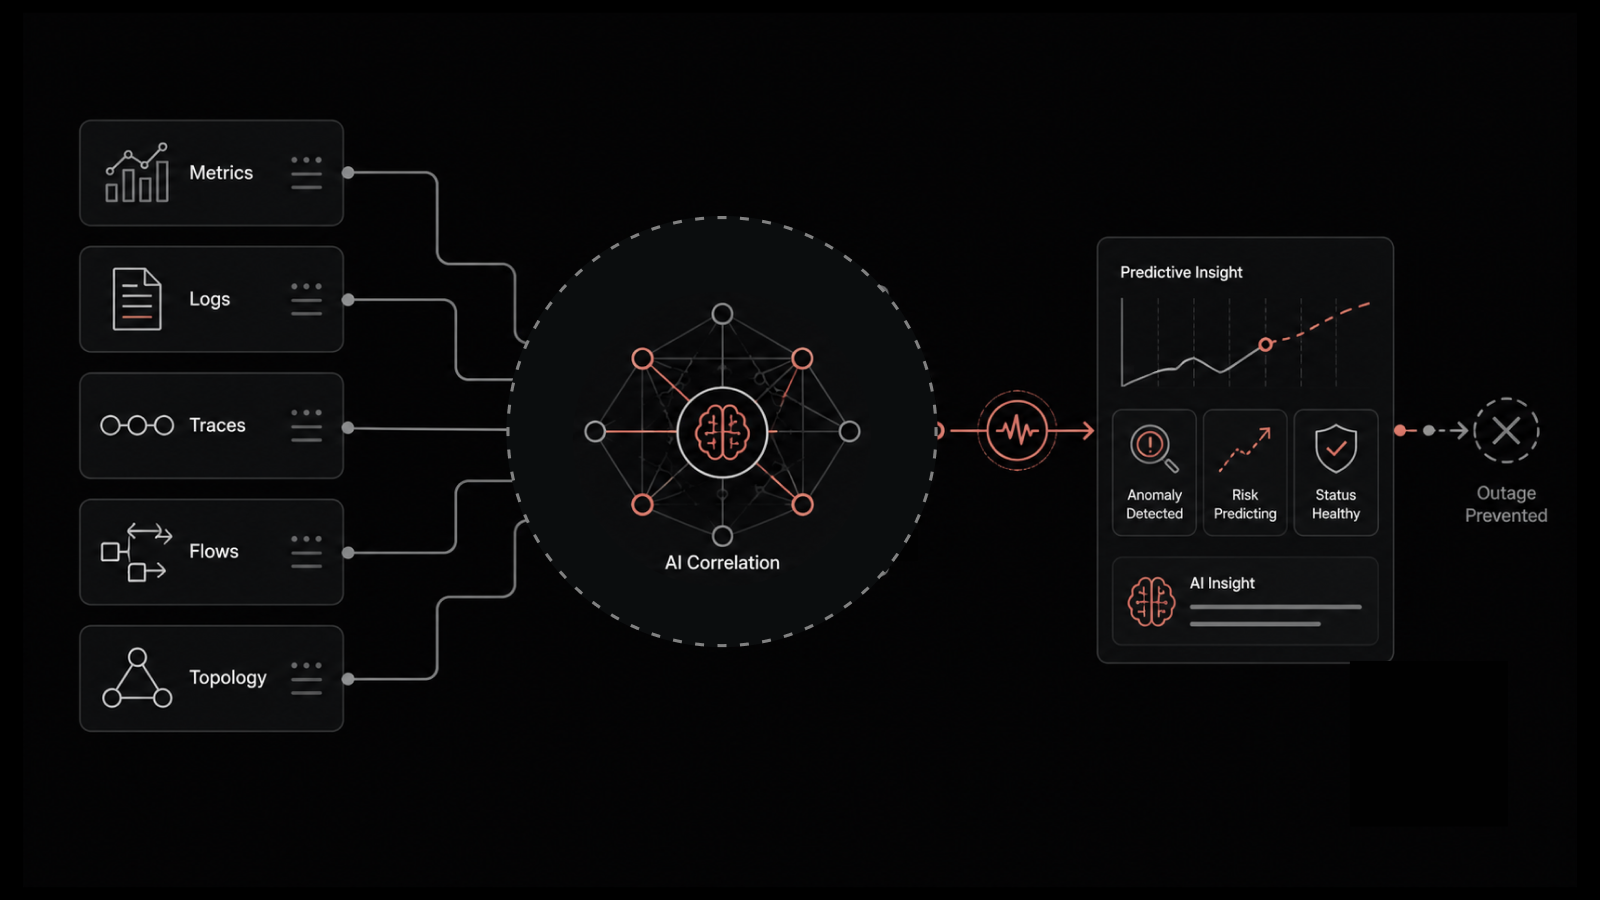
Traditional monitoring tools generate individual alerts for every threshold breach across every device. In a multi-client MSP environment, this produces an overwhelming volume of noise. Motadata's AIOps engine correlates related alerts across clients, infrastructure layers, and time windows to surface the actual root cause — not dozens of symptoms.
The result: technicians spend less time triaging noise and more time resolving real issues. Alert noise reduction of 70-90% is typical.
Predictive Anomaly Detection
Rather than waiting for thresholds to breach, Motadata's ML-driven anomaly detection identifies performance degradation patterns that precede failures. For MSPs, this means:
Catching disk capacity trends before storage runs out and impacts client applications
Identifying network congestion patterns before they trigger SLA-breaching latency spikes
Detecting authentication anomalies before they indicate a security compromise
Automated Ticket Creation and Routing
When the monitoring platform detects an issue, it shouldn't just alert — it should act. Motadata's unified platform automatically creates service desk tickets from monitoring alerts, assigns them based on client SLA priority, and routes them to the appropriate technician or group. No manual triage step, no lag between detection and response.
Unified Reporting: Turning Data into Client Confidence
MSPs don't just need internal operational metrics — they need client-facing reports that demonstrate value, justify pricing, and build trust. A unified platform that handles both monitoring and service management produces reports that tell a complete story.
Internal Operational Reports
Technician utilization dashboards showing billable vs. non-billable time across clients
SLA compliance trends by client, service category, and priority level
Incident volume and resolution patterns identifying clients that consistently generate high ticket loads
Capacity planning forecasts based on growth trends in monitored device counts
Client-Facing Value Reports
Uptime and availability metrics proving SLA compliance with hard data
Incident response and resolution summaries showing mean time to acknowledge and resolve
Proactive issue prevention counts — the incidents that were caught and resolved before the client noticed
Infrastructure health scorecards giving clients visibility into their environment's overall posture
These reports aren't just operational artifacts — they're retention tools. Clients who see concrete, quantified value from their MSP are far less likely to evaluate alternatives.
Scaling Your MSP Without Scaling Complexity
Growth is the goal for every MSP, but growth without operational scalability is a recipe for margin collapse. Adding 10 new clients shouldn't require hiring 10 new technicians or deploying 10 new monitoring tools.
Motadata's unified platform is designed for MSP-scale operations:
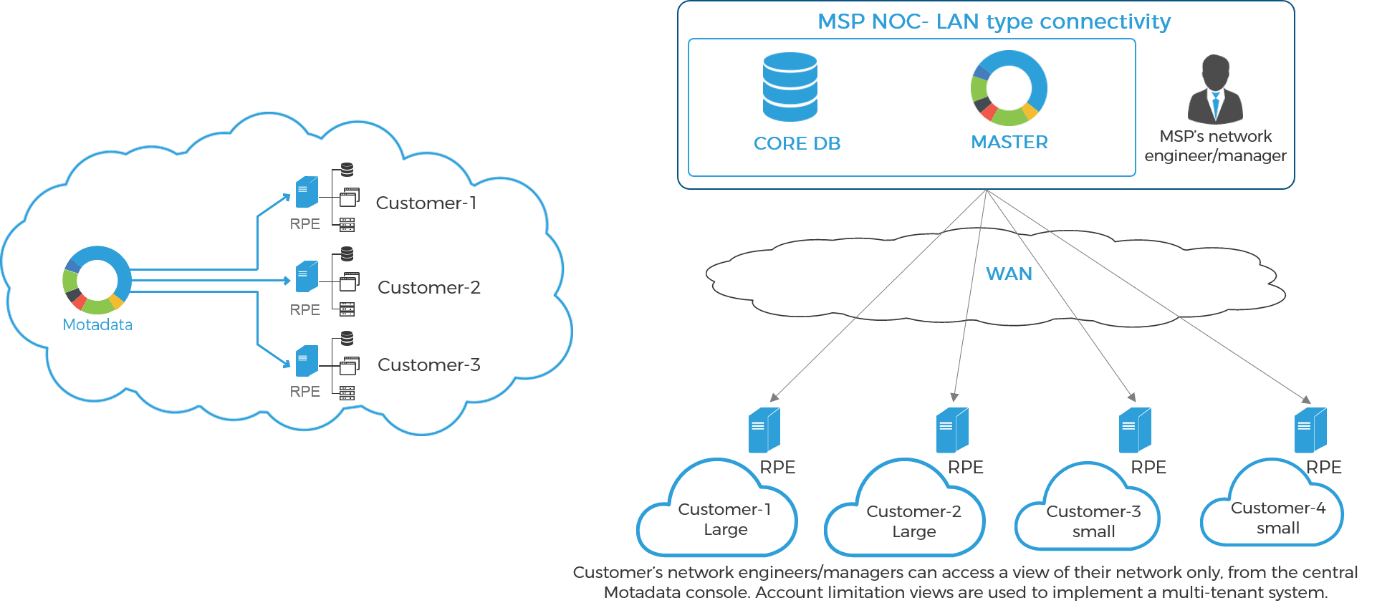
Multi-tenant architecture — manage all clients from a single instance with role-based access control ensuring data isolation
Template-driven onboarding — standardize monitoring configurations, SLA profiles, and service catalog entries so new clients are operational within hours, not weeks
Automated discovery — when a new client's infrastructure is connected, automated discovery identifies devices, maps dependencies, and applies monitoring policies without manual configuration
Elastic scalability — the platform scales horizontally as device counts and ticket volumes grow, without performance degradation or architectural limits.
Conclusion
The MSP market rewards operational efficiency above almost everything else. The providers that track technician time with precision, detect infrastructure issues before clients notice, and turn service delivery data into business decisions are the ones that grow profitably.
Motadata's AI-native unified product suite — combining ServiceOps for IT service management and an integrated network monitoring system — gives MSPs the platform they need to deliver exceptional client outcomes without proportional increases in headcount or complexity.
Motadata's AI-native unified product suite empowers MSPs with intelligent service management, proactive network monitoring, and automated operations. Start a free trial and discover how unified IT management drives MSP profitability.
FAQs
What is the biggest challenge MSPs face with tool sprawl?
Tool sprawl creates data silos, duplicates operational effort, and makes unified reporting nearly impossible. MSPs managing separate platforms for monitoring, ticketing, and reporting spend more time switching contexts than resolving issues. A unified platform eliminates these inefficiencies.
How does Motadata help MSPs meet SLA requirements?
Motadata's integrated platform links network monitoring alerts directly to service desk tickets with SLA-aware routing. When an infrastructure event is detected, a ticket is auto-created with the correct priority and SLA clock, ensuring response and resolution targets are tracked from the moment of detection.
What metrics should MSPs track to improve profitability?
Focus on average time per ticket, technician utilization rate, revenue minus COGS per client, and SLA violation trends. These metrics reveal which clients are profitable, which technicians are most efficient, and where operational bottlenecks are eroding margins.
How does AI-driven monitoring differ from traditional threshold-based monitoring?
Traditional monitoring fires alerts when a static threshold is breached. AI-driven monitoring learns baseline behavior and detects deviations from normal patterns — catching issues that threshold-based systems miss entirely. It also correlates related alerts to reduce noise and surface root causes faster.
Can small MSPs benefit from a unified platform?
Absolutely. Small MSPs often benefit the most because they can't afford the operational overhead of managing multiple tools. A unified platform reduces the learning curve, simplifies client onboarding, and delivers enterprise-grade capabilities at a scale-appropriate price point.