It doesn’t matter if you run a small, medium, or a larger scale organization; one thing you need to make sure is to run your IT setup smoothly, and hence you require someone to look after your entire IT infrastructure.
It is humanly impossible to keep an eye over the, ever increasing complex hybrid infrastructure. Modern IT teams today rely on intelligent network monitoring tool to proactively monitor their IT ecosystem to reduce downtime.
It acts as a first line of defense, when applications go down or when performance begins to deteriorate. According to a latest research by Markets & Markets, Network Monitoring Market is set to be worth $2.93 billion by 2024.
This clearly indicates that organizations across the globe are reaping the benefits of a robust network monitoring solution.
Guide to Choose Right Network Monitoring System (NMS)
In this blog we will deep dive into 4 use cases that any ideal monitoring should have.
1. Proactive Monitoring – Catch issues before it’s too late to avoid business impact
Can a monitoring tool really, proactively monitor and detect issues in the network? Yes, it is very much possible. An ideal tool proactively keeps an eye over the network entities and reduces TTD (Time to Detection) and monitors device health with the help of sensors.
In monitoring terms, it is called Polling engine which tells you if the device is underutilized or overutilized by capturing data metrics in the form of CPU usage, available memory or storage etc.
The tool also helps IT teams to decide on the severity of the event occurred in advance by customizing alerts based on severity codes like Critical, Major or Warning.
The alert updates can be sent to mobile or over an e-mail as a notification, which can be a very handy feature to give an urgent update about the event or failures that occurs.
2. Performance monitoring: Fix it before it breaks!!
Gone are the painful days of manually optimizing the performance of a system, which resulted in waste of productive time for the network admin.
Performance monitoring enables them to monitor the performance of a network and build a baseline (minimum accepted performance), which is determined by historical data. Let’s understand the concept through an example of Linux performance monitoring.
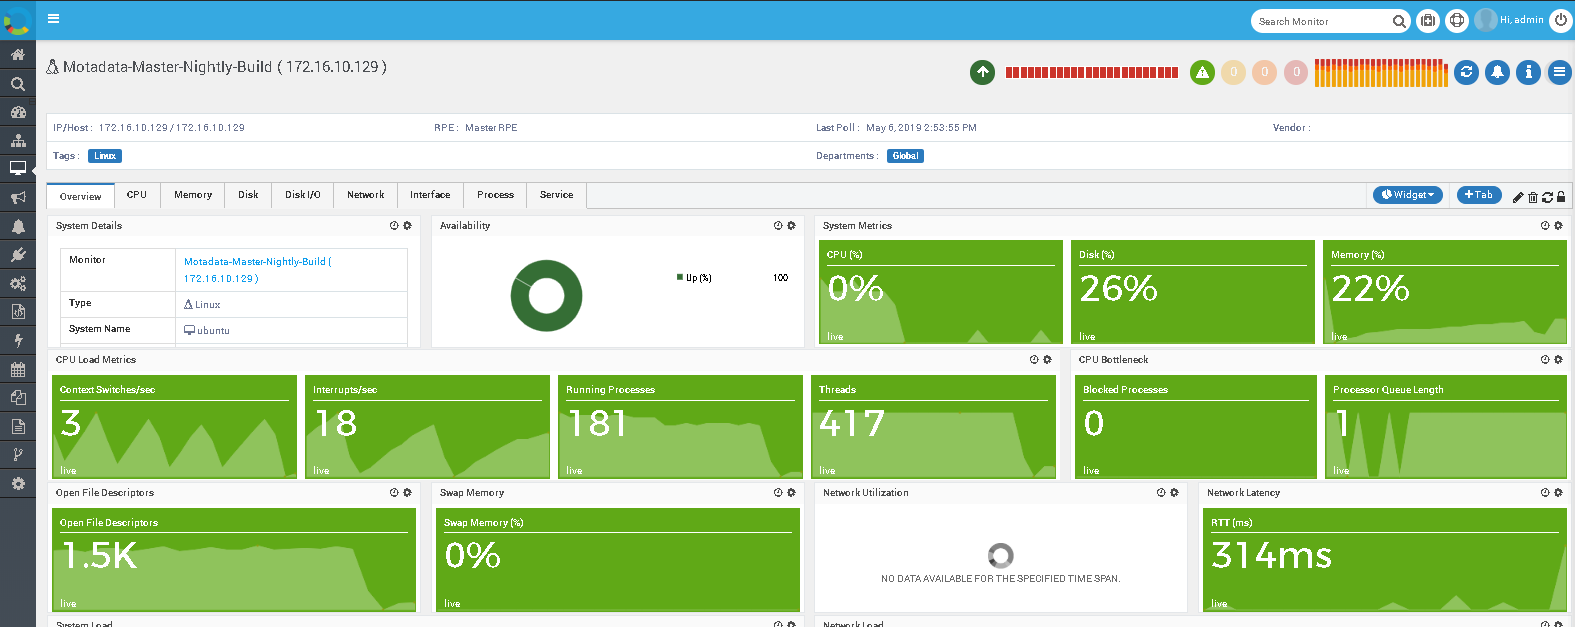
The Overview tab of a Linux machine on Motadata Dashboard provides an overall view of the monitors on various metrics in both numerical and graphical formats.
CPU historical performance graphs:

Memory historical performance graphs:

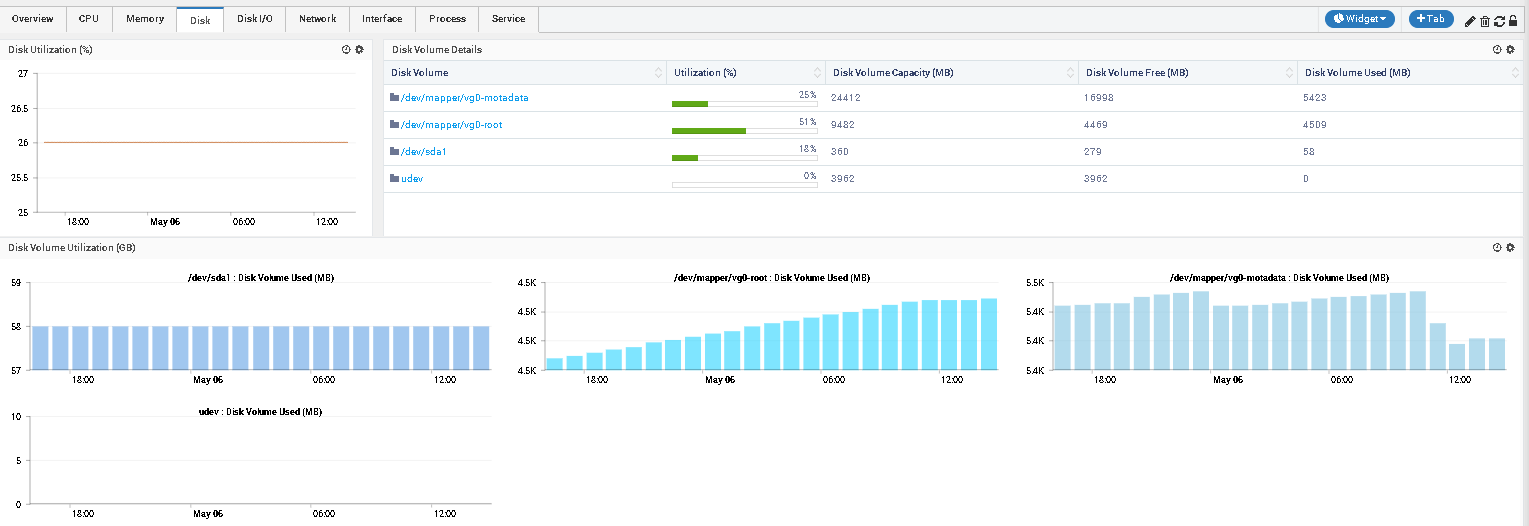
Disk historical performance graphs:
So, to summarize, when we consider an overall performance of the enterprise network an ideal tool should provide various features and a wide range of performance monitoring style in an eye-catching format that helps organizations to make informed decisions.
3. Troubleshooting: A shot in a dark!!!!
It is very difficult for Network admins in an extremely complex IT ecosystem to troubleshoot, which is like finding a needle in a haystack.
And they are always in a dilemma whether it is a network issue or an application issue. They constantly waste their precious time to identify the cause and what to troubleshoot in order to resolve the issue.
An ideal monitoring tool can come in hand for an effective troubleshooting that is based on historical alerts and performance trends that aids in quickly resolving user queries.
An ideal tool offers you with conclusive troubleshooting results i.e. whether application / resource is available or not, by monitoring applications like Apache, JVM, IIS, and various available Databases, etc.
If the solution comes pre-bundled with bandwidth monitoring, it could also easily identify bandwidth hogs who choke up the network and affects its performance.
4. Network change: Who moved my cheese?
What could be the most disastrous thing for any IT team? The asset that you manage or track go awry.
There are instances in a big organization where the assets are handled by multiple people. In such a scenario, if a change is made in the configuration without the network admins knowledge’s they would have hard time fixing the unstable devices to bring the connectivity back to normal.
Such issues are quite rare, but are unavoidable as anything can happen, even in the most secured places.
This is where an NCM (Network Configuration Manager) comes to the rescue of network admins.
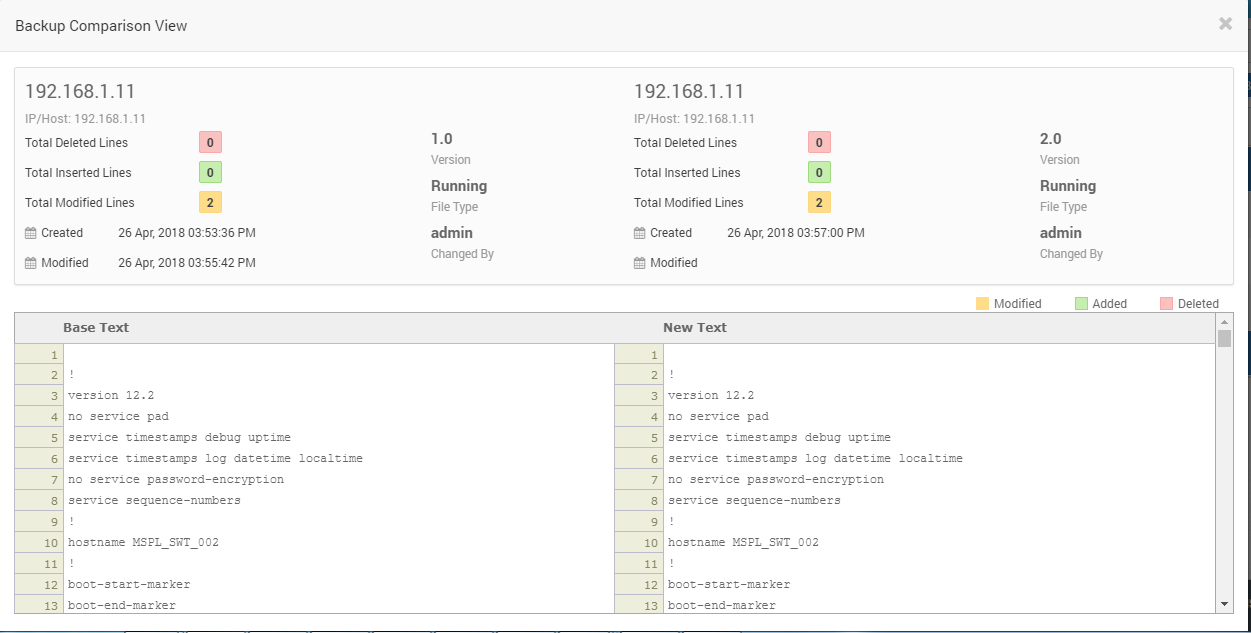
It quickly detects the configurational changes made in any of the devices that affects its performance by comparing it with the most recent good configuration.
This gives peace of mind to the network admins who can rely on NCM to roll back network setting if such an issue arises.
So, to conclude, a wisely chosen Network monitoring tool can be a game changer for your company’s operational efficiency that aims to achieve zero downtime.
Motadata helps you achieve just that with real-time monitoring that lets you take corrective action and minimize downtime. It also eliminates the need to have a system admin who performs various manual checks on a daily basis.
This saves both – companies time and money and addresses problem effectively. To know more how Motadata can add value for all your monitoring needs, download the free trial now.


